Instacart vs Amazon vs Uber
 Jan-Erik Asplund
TL;DR: Instacart hit $2.5B in revenue and 29% market share of online grocery capitalizing on the customers and infrastructure of existing grocery stores—for their next act, they’ll need to retool as a high margin software business helping those stores make up their margins. For more, check out our Instacart dataset and our report on key profitability drivers in online grocery.

Key points from our research:
- Circa 2010, you’d physically go to the grocery store within a single-digit mile radius of you, pick and pack your own groceries (average basket size of $30 to $40, ~2% profit margin for the store), and pay for your own transport to and from the store. New grocery stores launch at a cost of about $500K where there are roughly 50,000 people within a 15-minute drive, average about 45,000 square feet in size, require state, city and county permits and generate about $14M per year in revenue. (link)
- Like Postmates (2011) did with restaurant delivery, Instacart (2012) launched in SF as a TaskRabbit for groceries, sending gig workers in your stead into uncooperative supermarkets to pick & pack groceries, checkout and deliver in ~2 hours with a 15% markup on top. This model lost them $15 on each delivery, but fueled by $300M in VC, Instacart rapidly scaled up its asset light grocery model, aggregating customer demand for online grocery in its app, growing to $100M in annualized revenue by January 2015. (link)
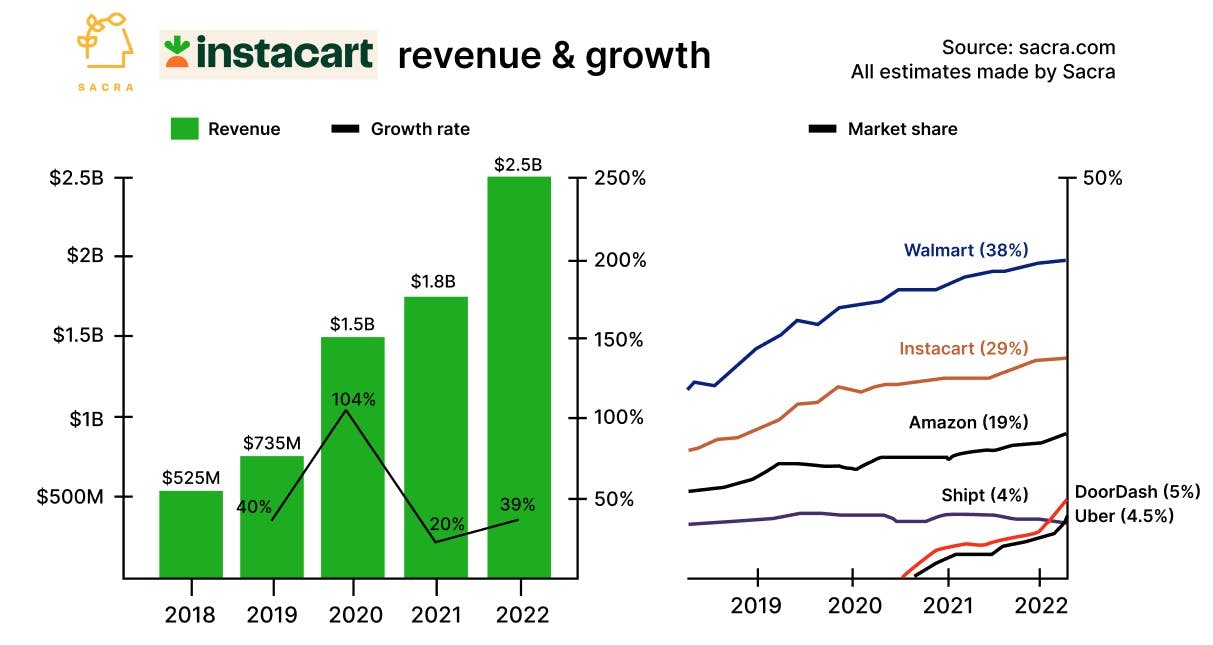
- Today, Instacart is at $2.5B in revenue, up 39% year-over-year, with $29B in gross transaction volume and $100M in EBITDA, which puts Instacart’s net margin at about 16%—at their current $12B valuation, that’s a 4.8x multiple on trailing twelve months (TTM) revenue. Compare to DoorDash (NYSE: DASH) at $6.6B revenue in 2022, up 34% from the year before, with gross margins around 12% (3.55x TTM multiple on $24.7B valuation)—and Uber (NYSE: UBER) at $8.6B of revenue, up 19% from the year before, with gross margins around 2% (2.26x TTM multiple on $73.6B valuation). (link)
- Amazon’s acquisition of Whole Foods in 2017, which represented 43% of Instacart’s gross merchandise value (GMV), brought about the modern alignment of Amazon with Whole Foods vs. Instacart with Costco (NYSE: COST, $215B, Albertsons (NYSE: ACI, $12B), and other large retailers. Instacart “armed the rebels” for grocers to compete with Amazon, offering them online grocery as a feature and incremental demand from its user base in exchange for paying a 5-8% take rate. (link)
- COVID lockdowns turned online grocery delivery from a luxury to a must-have, pulling forward demand by a decade—online grocery delivery and pickup went from 3% of the $1.5 trillion grocery market to 10% in the span of 2 years. By flooding stores with demand, COVID temporarily amplified basket sizes and quantity of orders, accelerating Instacart’s growth from 40% to 100% year-over-year—post-COVID, with prices of online groceries now up 14% year over year, demand has pulled back and growth decelerated to pre-COVID levels as consumers tightened their belts. (link)
- Uber and DoorDash launched grocery shopping in 2020 to go after Instacart, using their existing network of mobile couriers to quickly get to near-parity with Instacart’s breadth of retailers, working with large chains like Aldi (2,100 stores) and Sprouts (400 stores). As of 2022, Uber Eats and DoorDash have grown to own about 5% each of the online grocery market, behind Amazon (20%), Instacart (29%), and Walmart (38%). (link)
- Dark warehouse delivery companies like Gopuff promised to drive contribution margin through vertical integration of the supply chain, but being capex heavy, resulted in long payback periods and capital shortages as VC money dried up in 2022. Today, GoPuff represents about 18% of convenience deliveries, vs. 16% for Instacart—their core ecommerce business generated about $1B in revenue in 2021, up from $340M in 2021, but lost $500M overall paying to lease and staff 200+ fulfillment warehouses. (link)
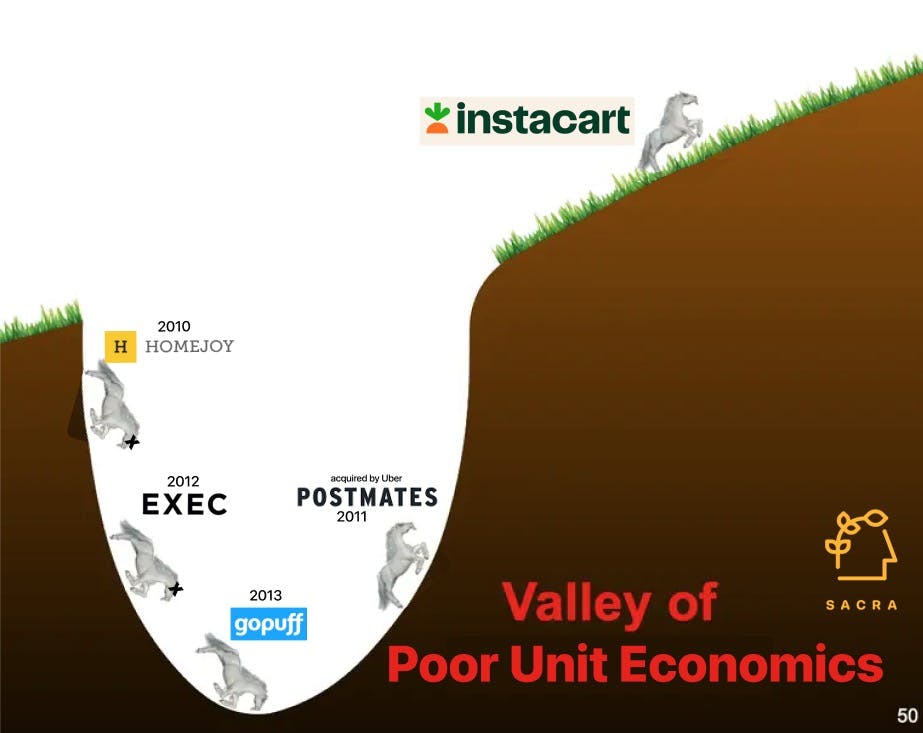
- As of 2023, Instacart has pulled itself out of the valley of negative unit economics, outlived its competition and become the leading 3rd party grocery delivery service—and now it’s leveraging its ownership of the interface to drive higher-margin (80%) CPG partnerships (~$550M revenue and 30% of top line in 2021) that give brands prime placement on its digital shelves in the form of feed and search results. Layering high-margin software revenue on top of its 20% marketplace take rate means building out software for each side of its and its 4-sided marketplace of consumers, suppliers, gig workers and advertisers, including a shopping superapp for consumers, vertical SaaS for merchants, and fintech for the gig workers. (link)
- The upside case for Instacart lies in indexing on the growth of online grocery GMV, which still represents just roughly 10% of the $1.5 trillion market for total grocery in the United States, growing 11% per year. As the largest marketplace for online grocery, Instacart has network effects that make it durable to competition, particularly as marketplace participants integrate into it as a utility. (link)

For more, check out this research from our platform:


