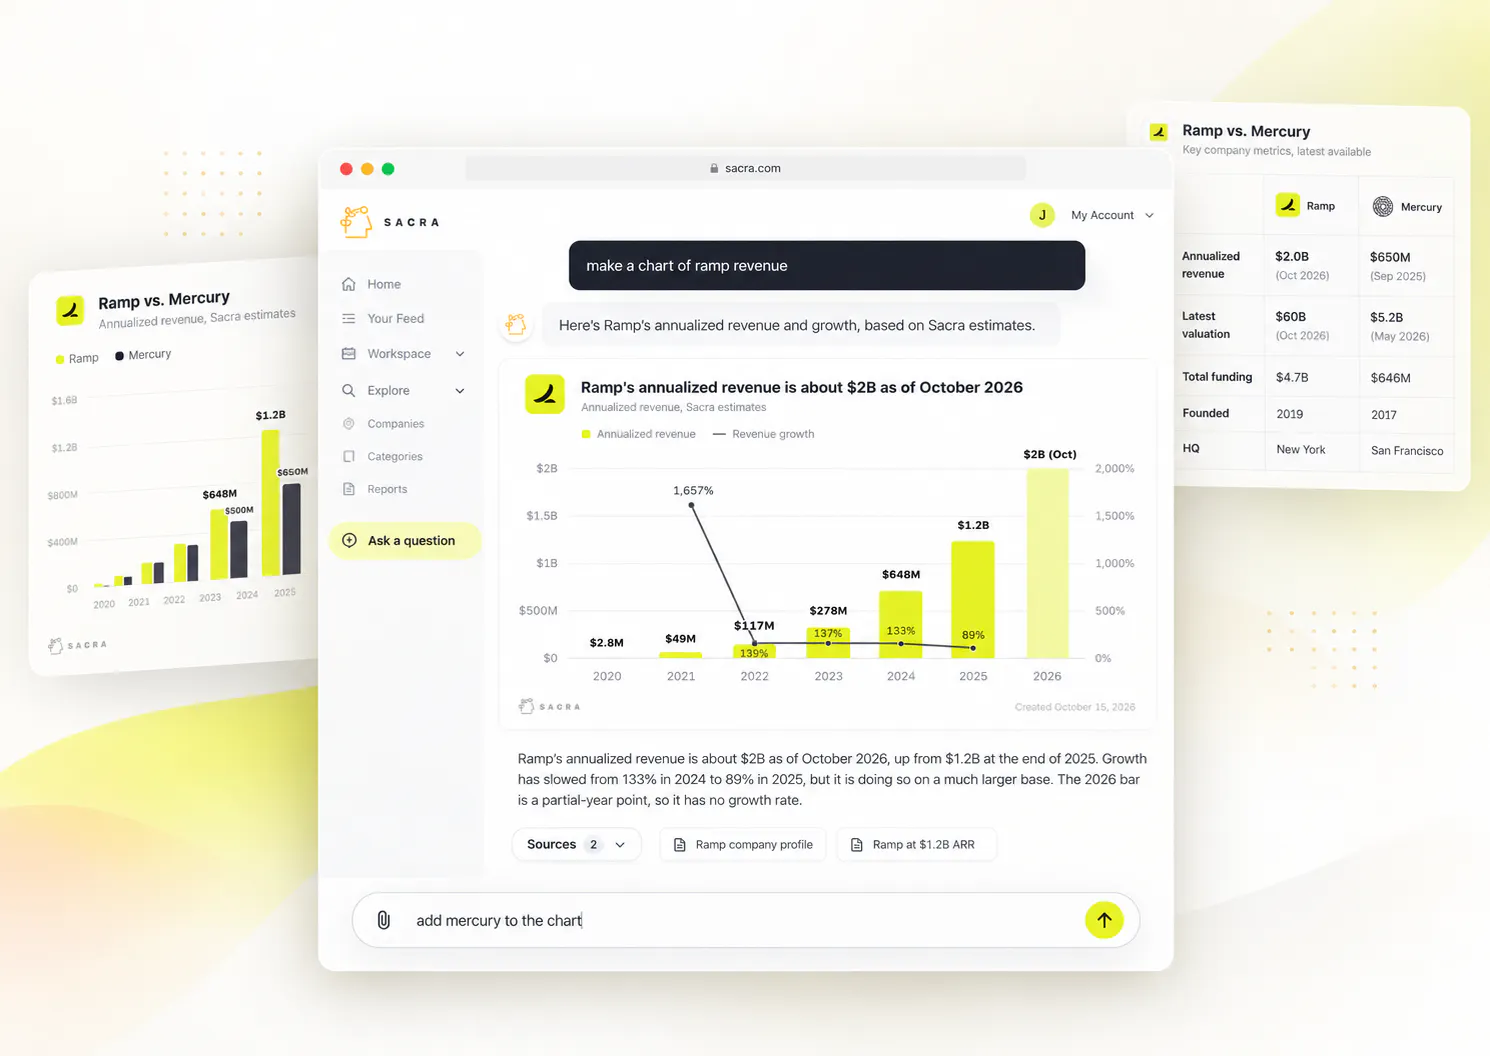
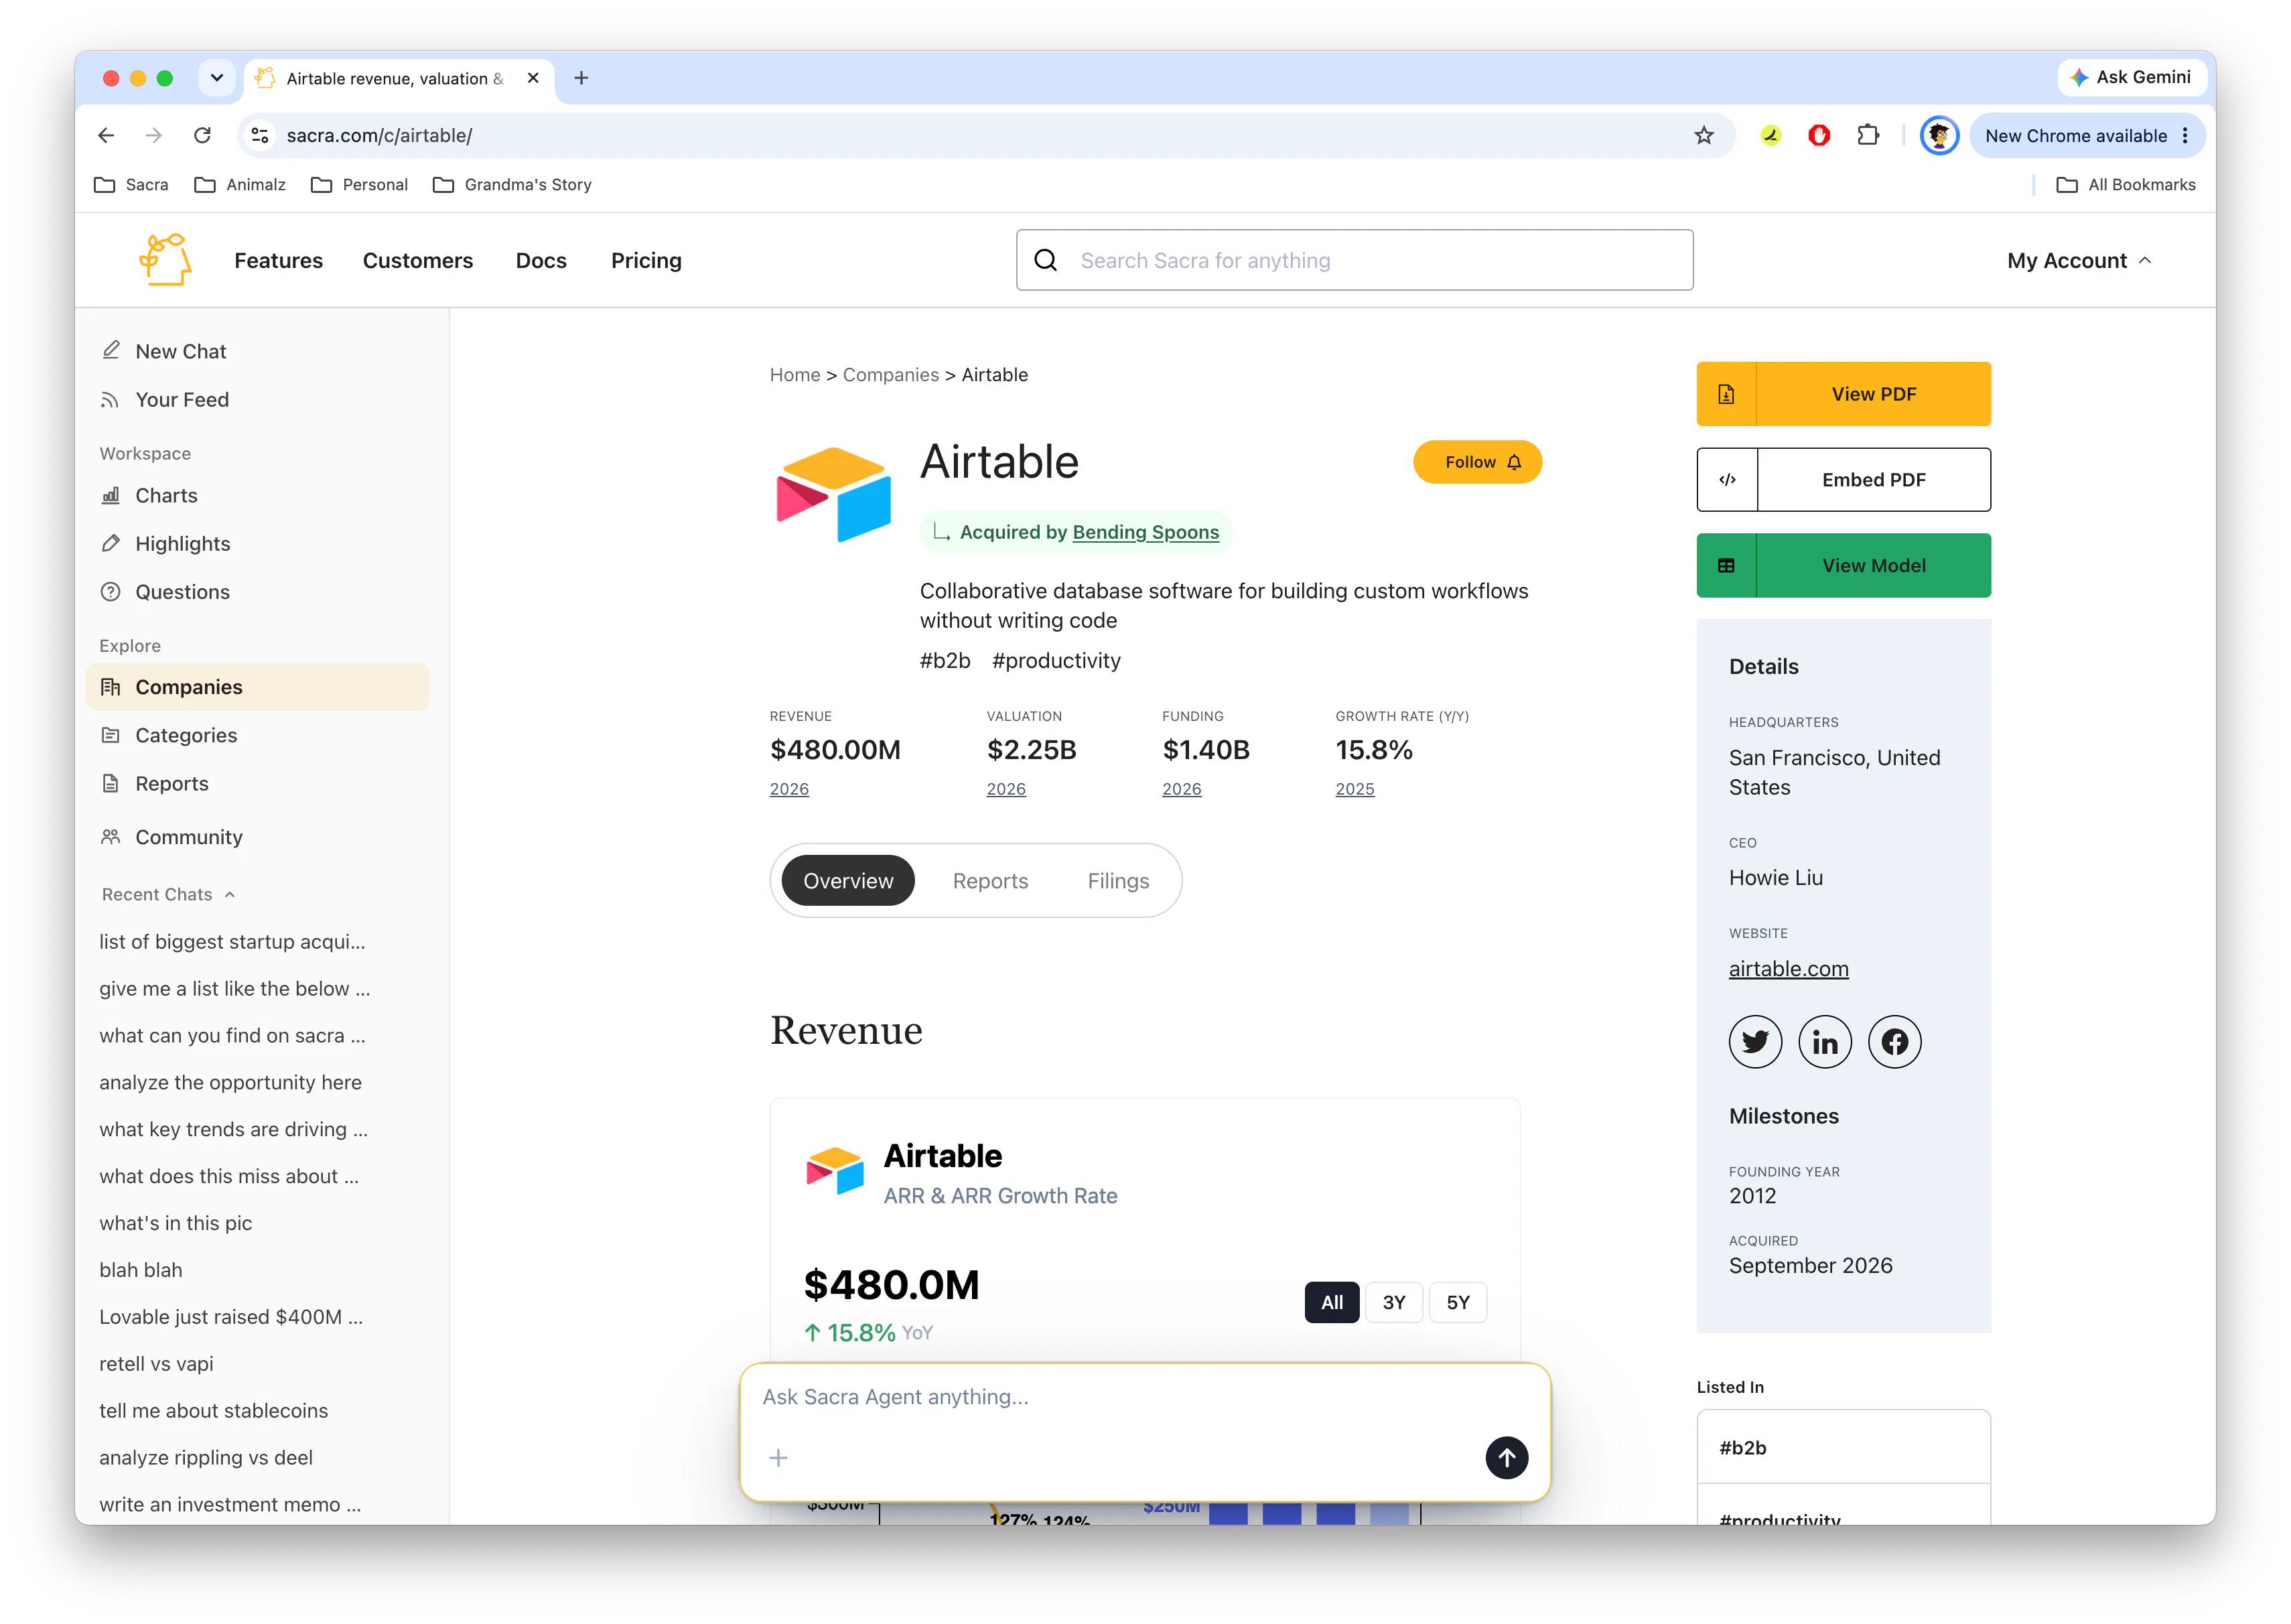
We're launching Sacra Metrics, a new tab on Sacra company pages that brings together revenue, growth, valuations, funding history, and comparable company data in one place.
Explore a company's financial performance over time, see how its valuation has changed, and compare its metrics against peers through charts and visualizations built from Sacra's private company data.
All the numbers in one place
Sacra has revenue estimates, funding rounds, valuations, and growth data on thousands of private companies.
Until now, exploring that data meant looking through company profiles, reports, and individual charts to piece together the full picture.
With Sacra Metrics, we're bringing that data together into a single dashboard on each company page.
Open the Metrics tab to explore a company's revenue trajectory, funding history, valuation, and how it stacks up against comparable companies.
Revenue and growth
See how a company's revenue has evolved over time, alongside its year-over-year growth rates.
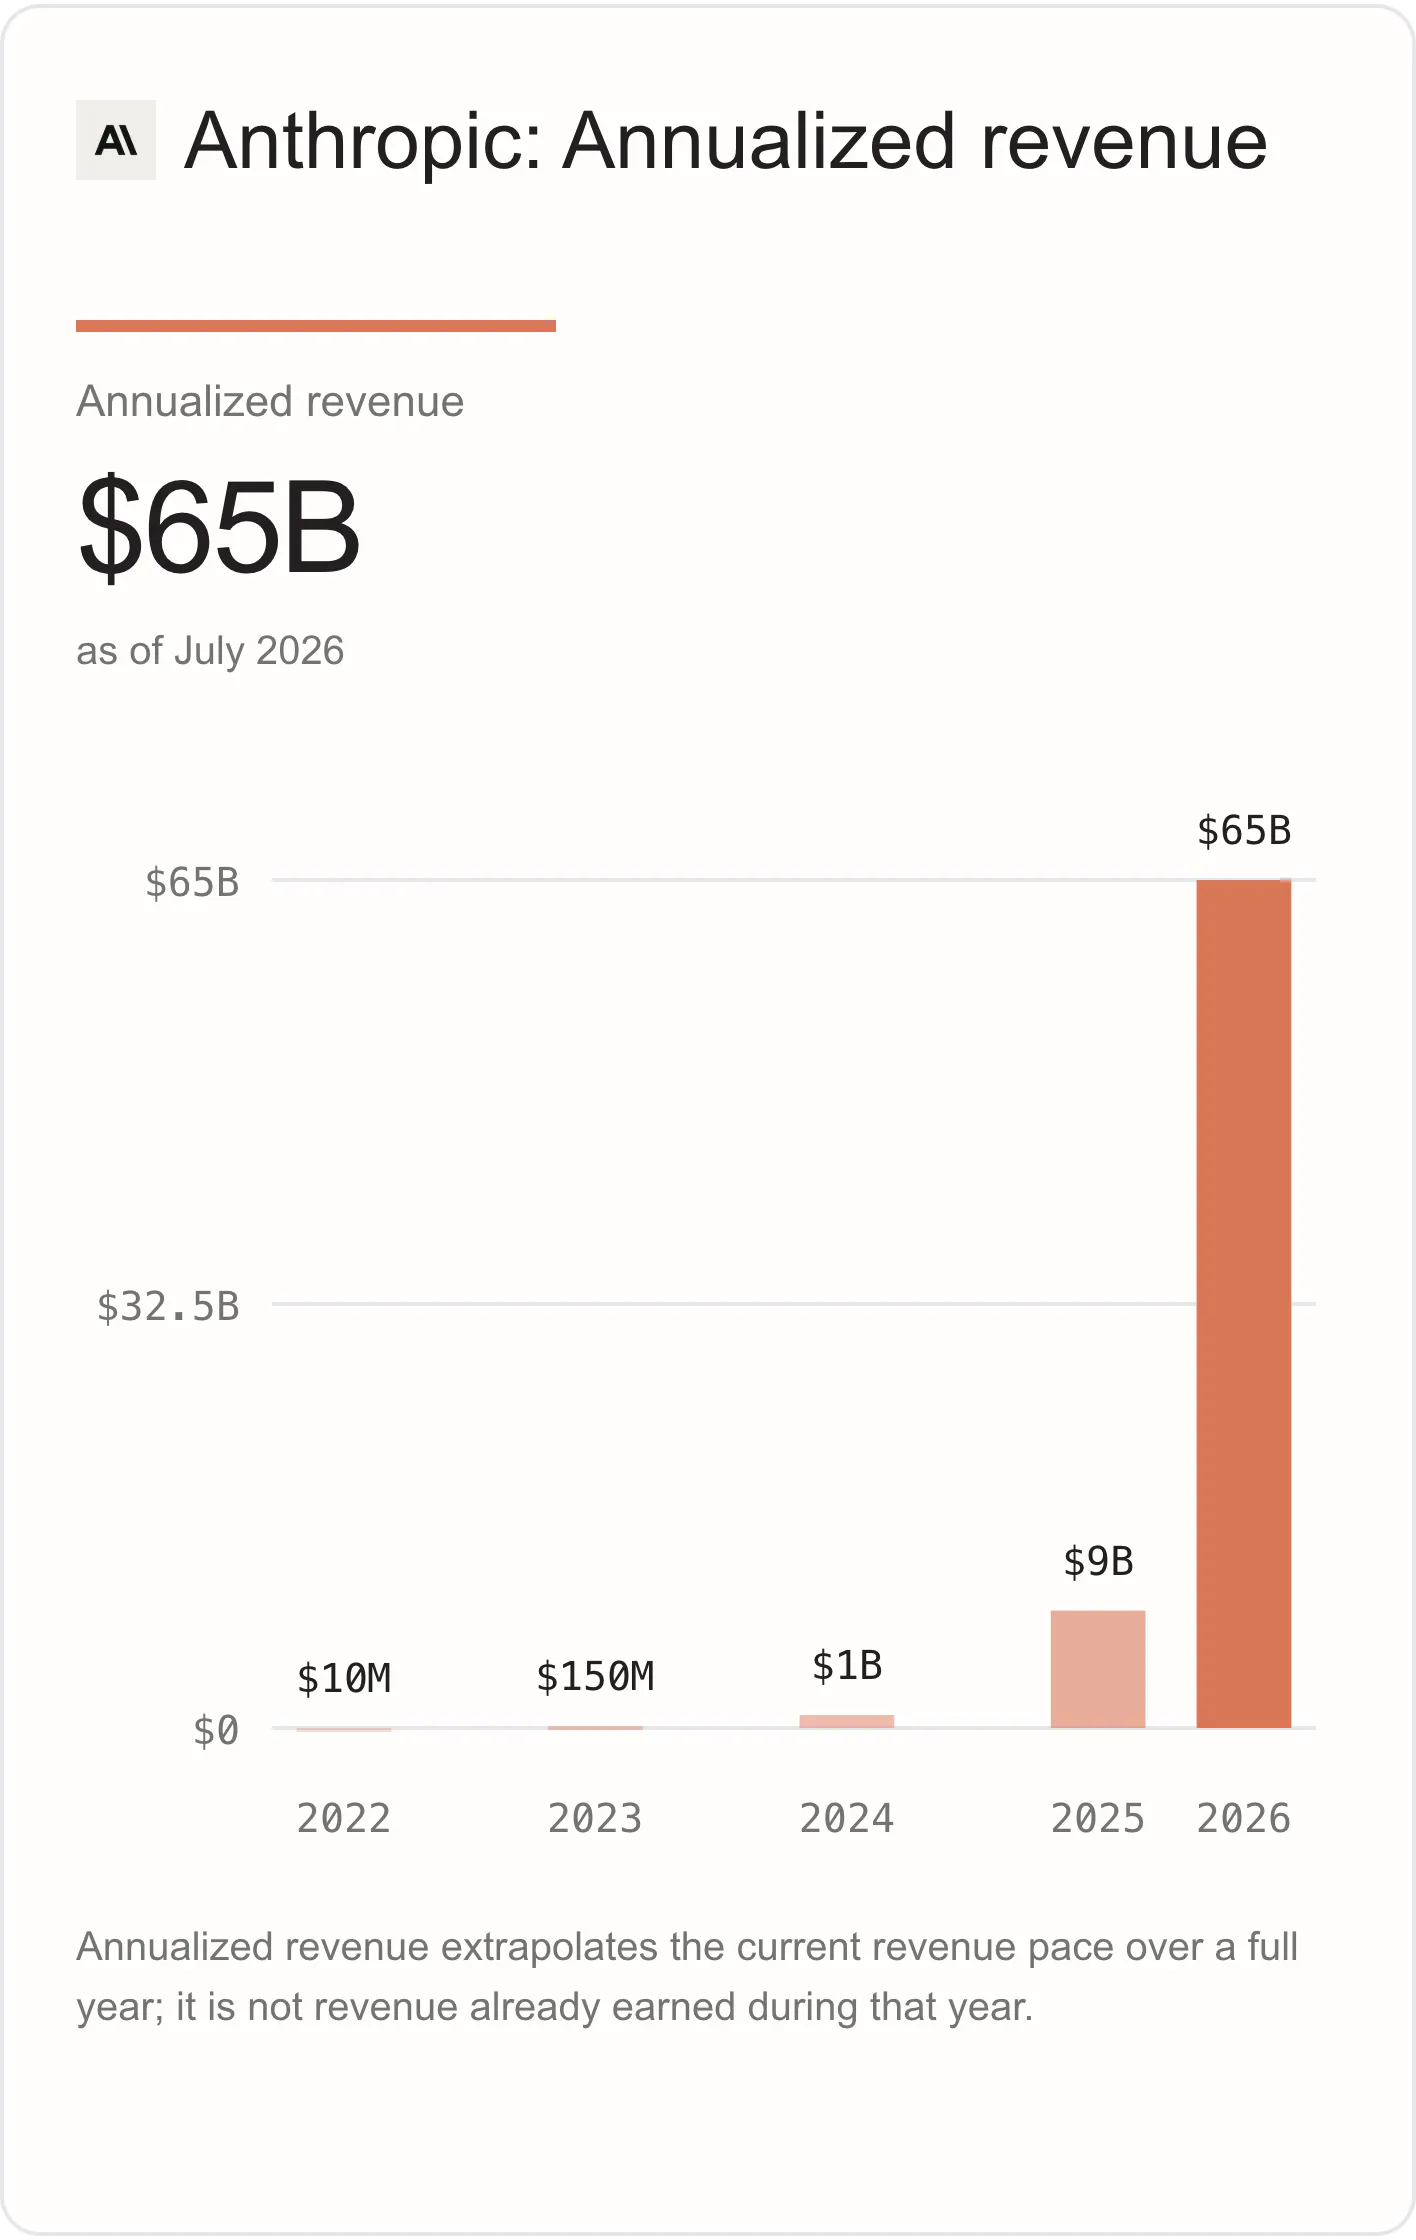
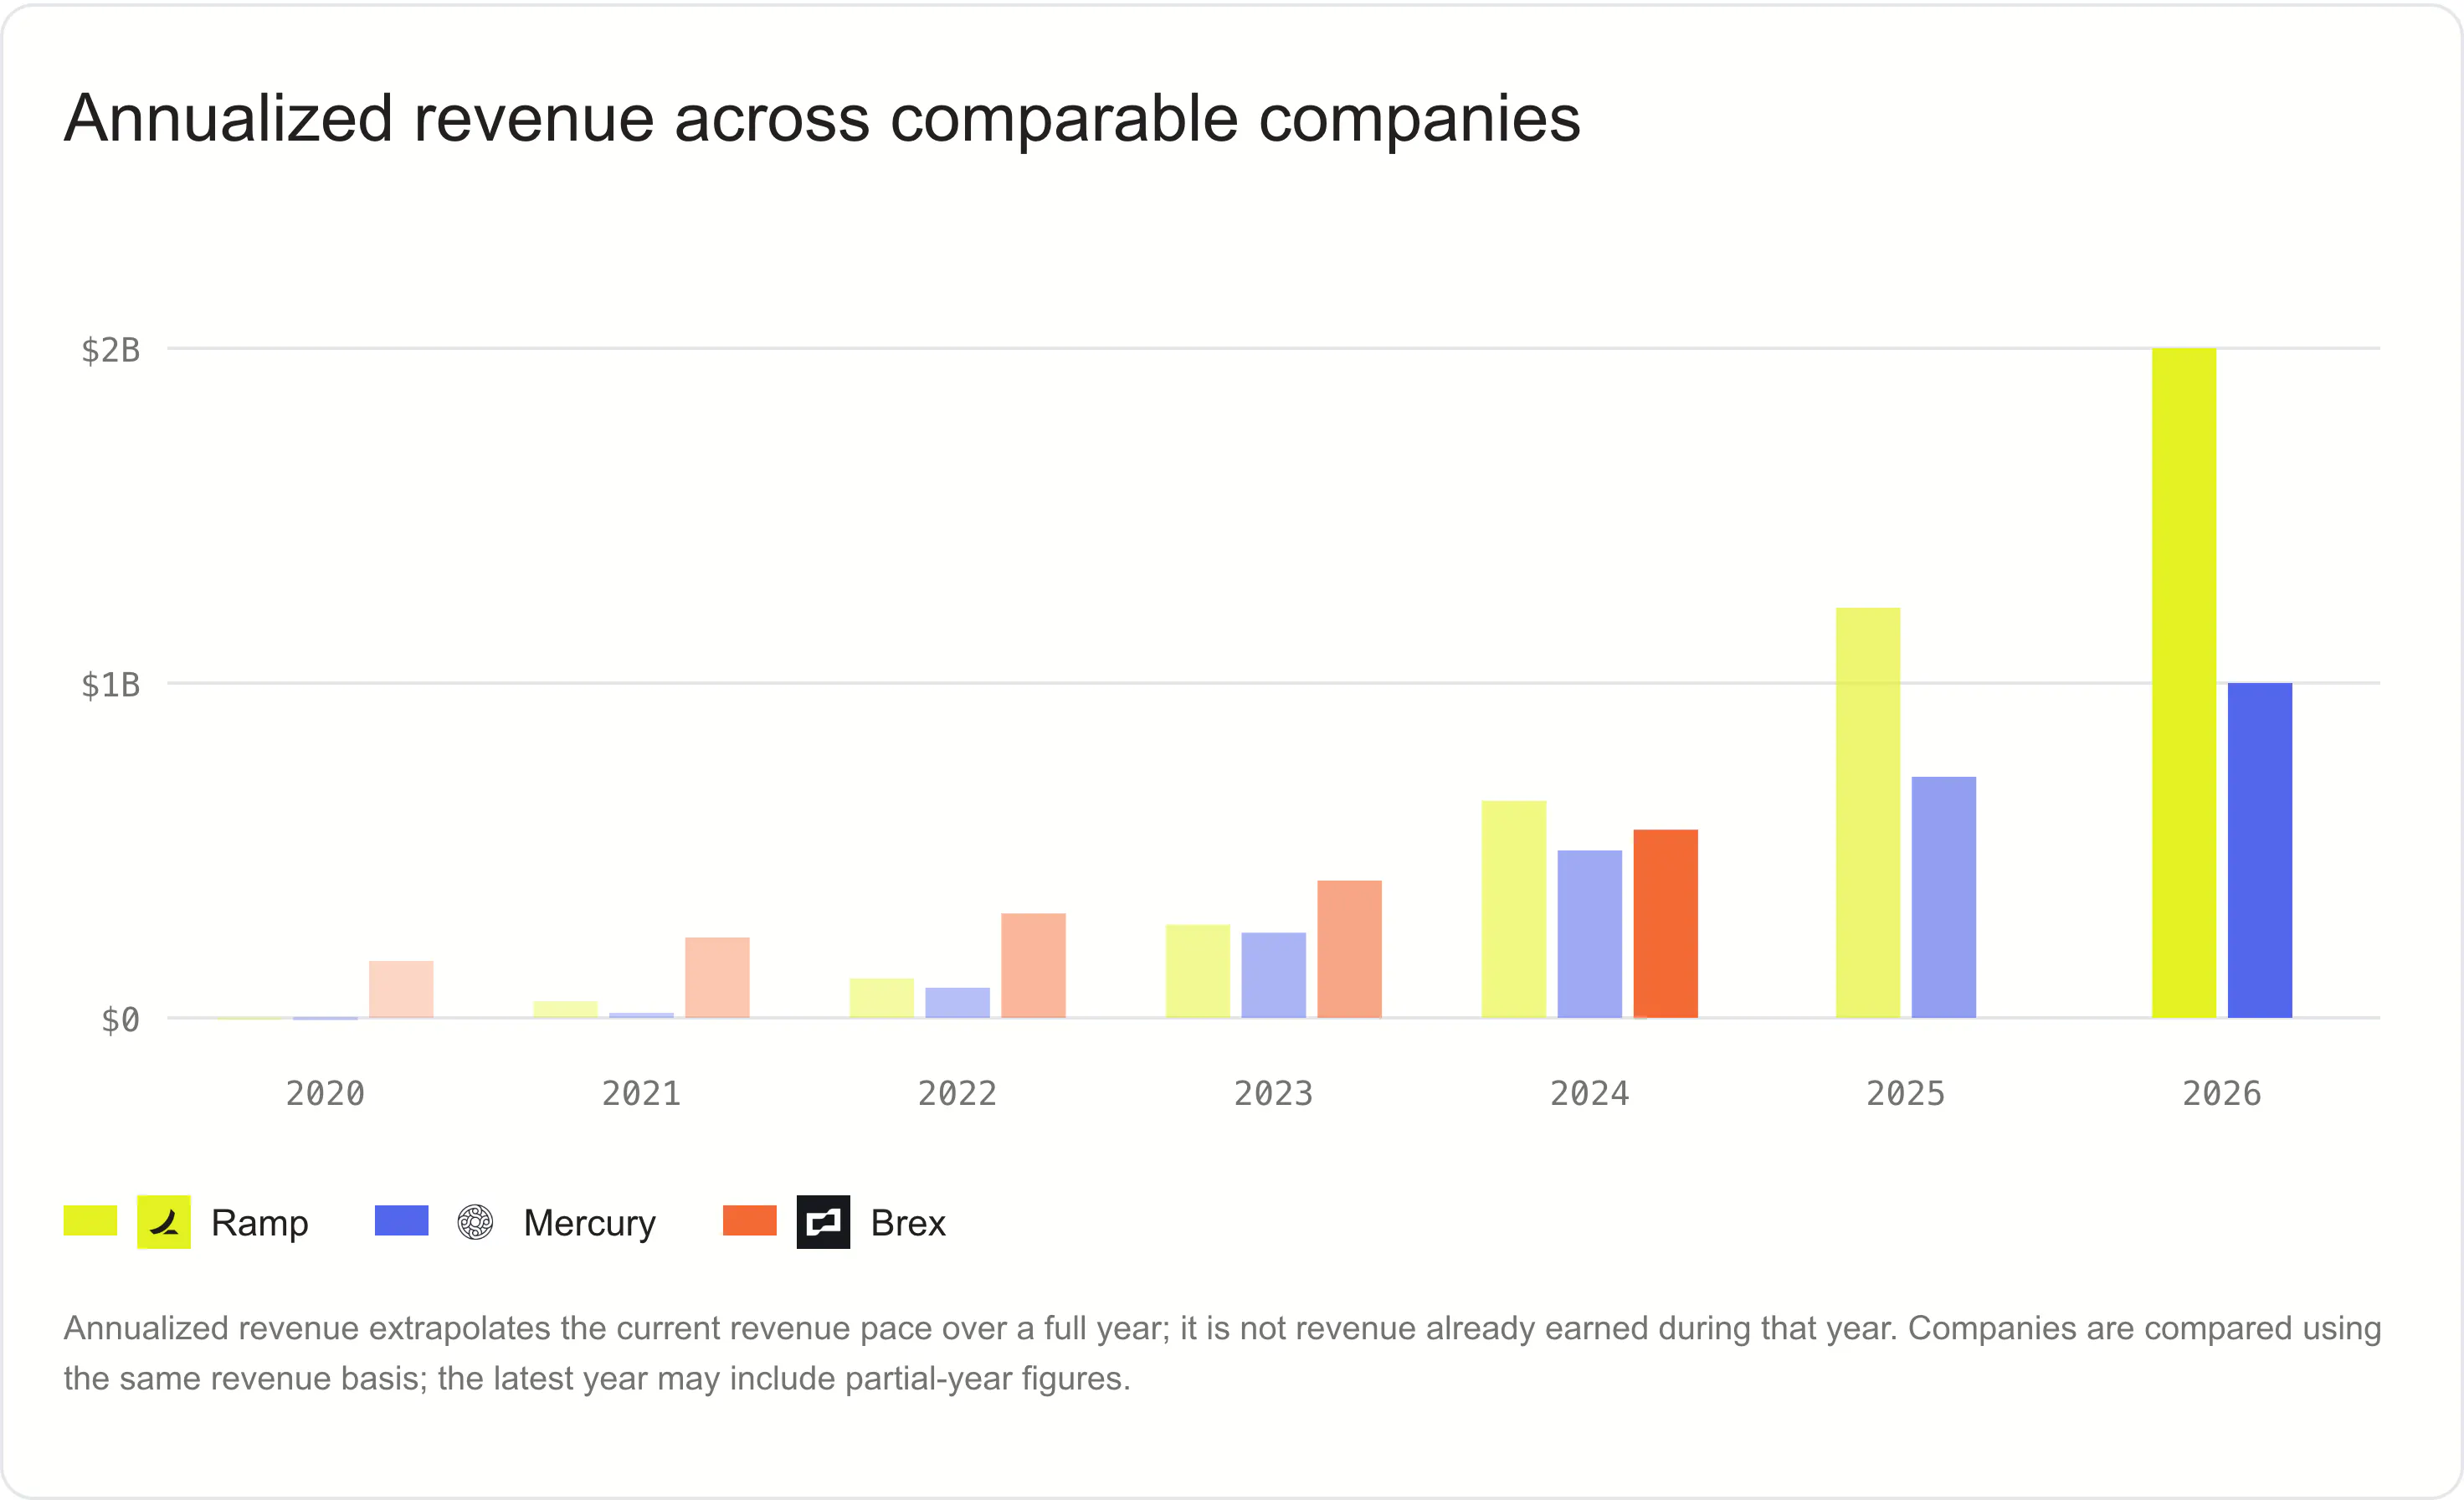
Explore Anthropic's revenue trajectory, look at how Anduril's business has grown, or see how Ramp scaled from $2.8M in annualized revenue in 2020 to $2B in October 2026.
Each chart includes the underlying financial metrics, reporting periods, and context around the data so you can see how the business has developed.
Funding and valuation
Sacra Metrics also brings together a company's fundraising and valuation history.
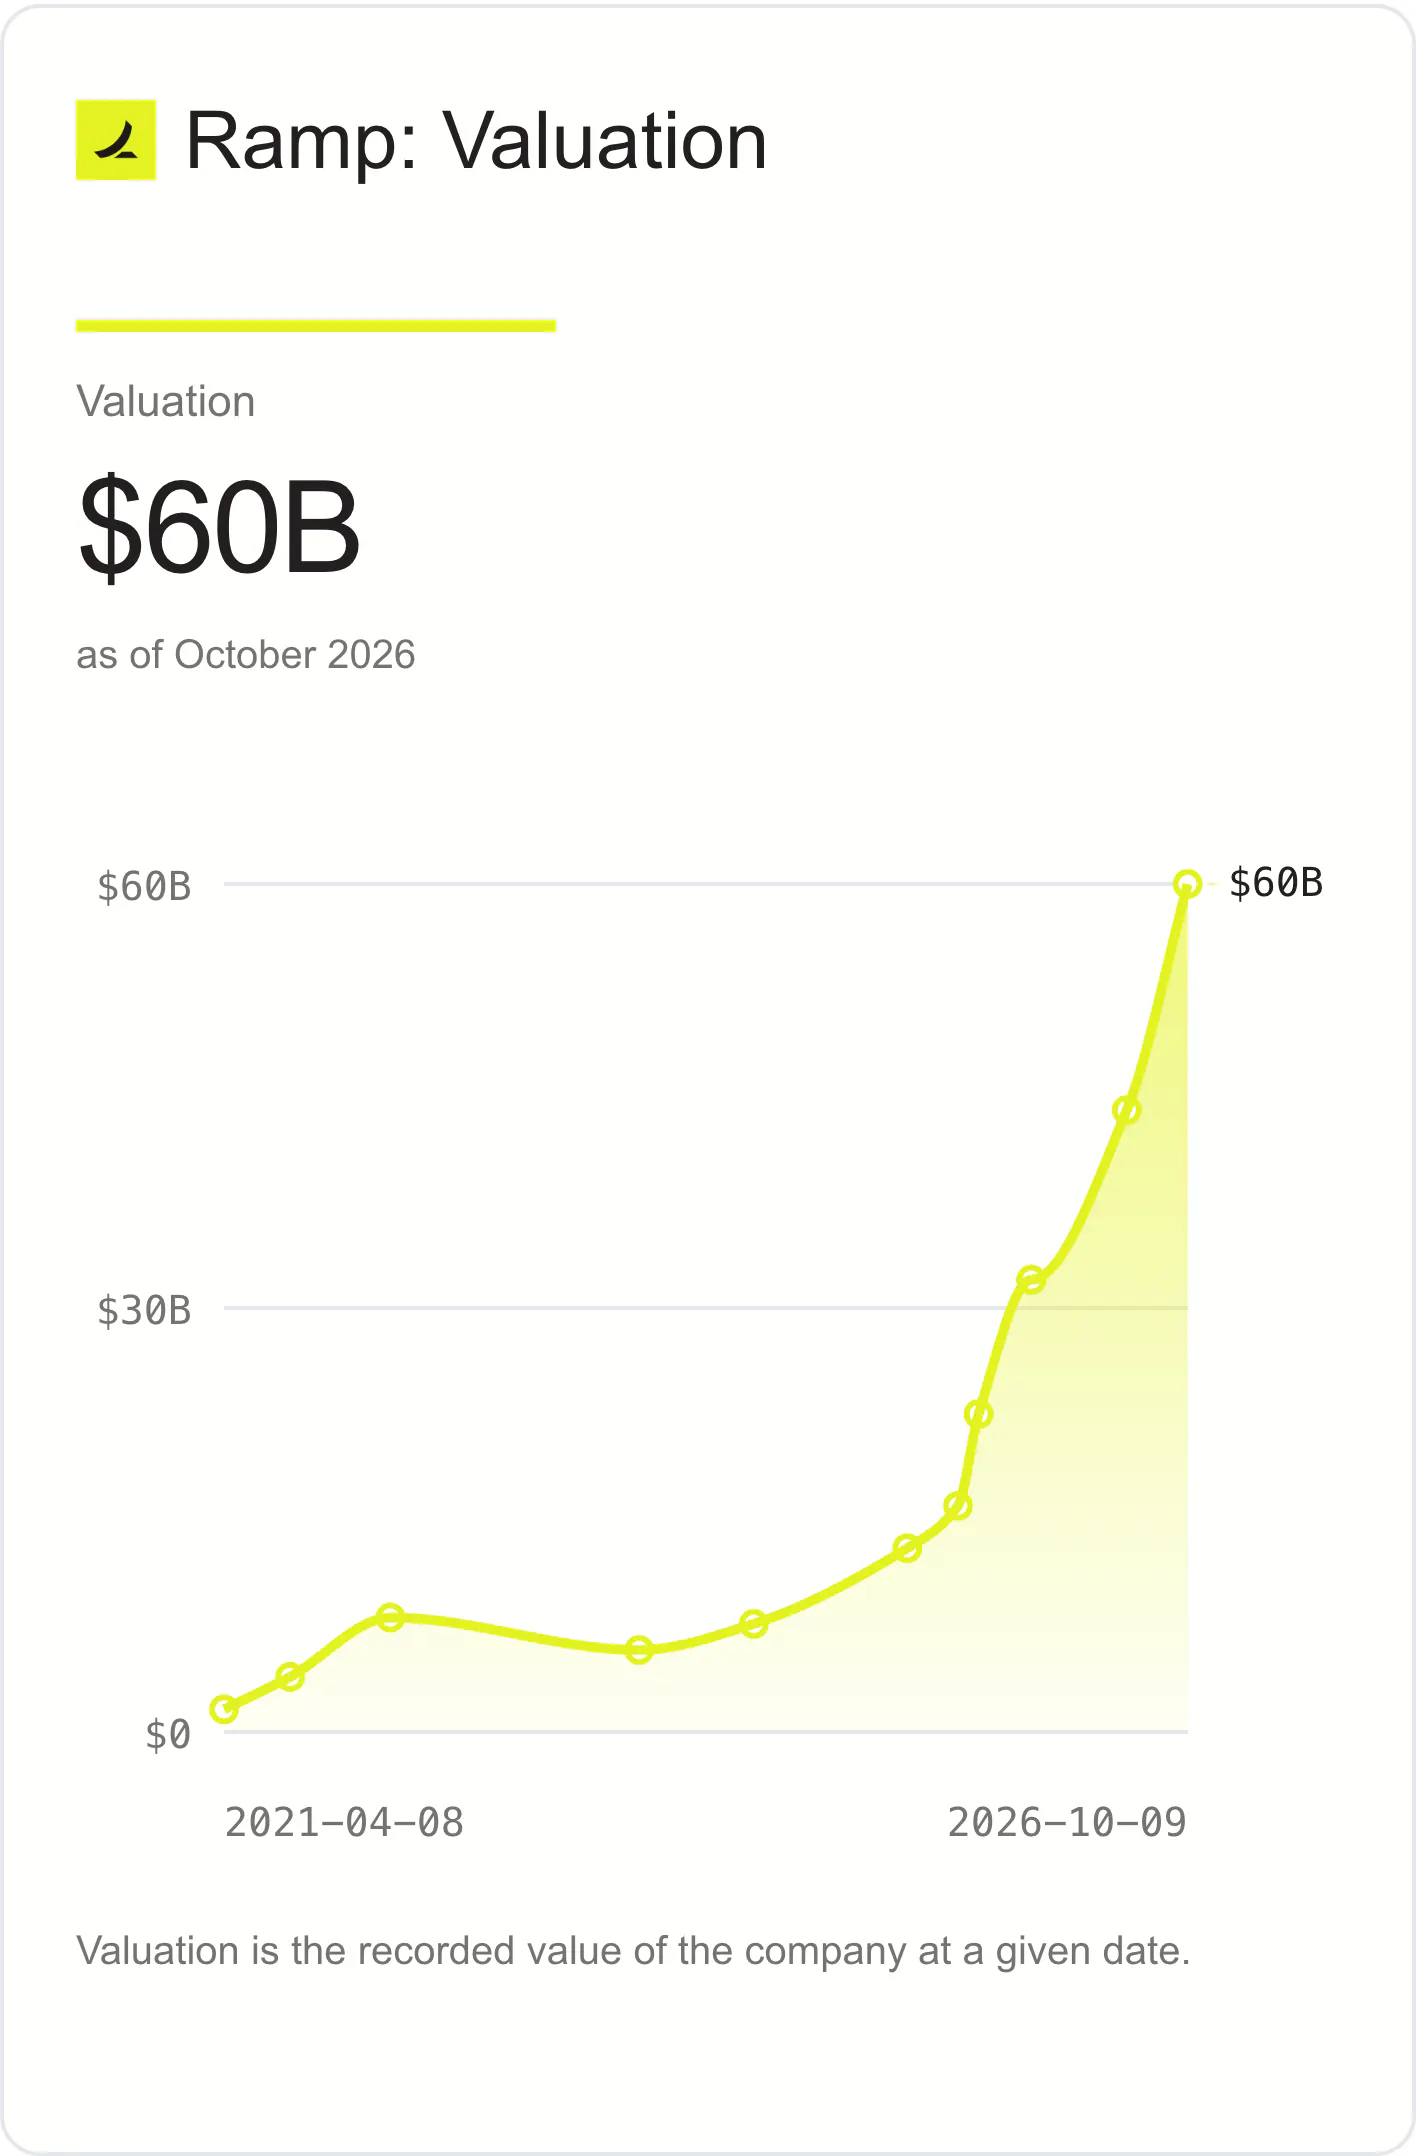
Explore funding rounds, amounts raised, post-money valuations, and share prices to see how a company's valuation has evolved alongside its business.
For companies like Ramp, you can look at how funding and valuation have changed over time, without having to piece together individual fundraising announcements.
Compare companies
We've also added a Comparables section to put a company's financial performance in context.
Compare companies across:
- Revenue: See how annualized revenue stacks up against peers.
- Growth: Compare year-over-year revenue growth rates.
- Valuation: See how companies are valued relative to one another.
- Valuation / revenue: Compare valuation multiples across companies.
- Revenue vs. growth: Visualize how companies compare on both revenue scale and growth.
Whether you're researching AI companies like Anthropic or fintech companies like Ramp, you can see how a company's financial performance compares with others in its market.
Getting started
Sacra Metrics is available directly on Sacra company pages.
Open a company profile, select the Metrics tab, and start exploring the data.
Questions or feedback, email us at founders@sacra.com.