
WeWork: Behind Their Overpriced $9B SPAC
 Nan Wang
This report contains company financials based on publicly available information and data acquired by Sacra during the preparation of the report. Sacra did not receive any compensation from WeWork for the report. This report is not investment advice or an endorsement of any securities. Click here to read our complete disclaimers.
History repeats itself
Join our list for more of our exclusive private markets research and company coverage.
Success!
Something went wrong...
Last month, WeWork announced it would be going public again—this time, via a SPAC.
The $9B enterprise value of WeWork's SPAC is a big markdown to its previous $47B valuation, however, we believe it is still expensive despite improvements to the business and structural tailwinds.
Last December, we published a report on WeWork. Our core thesis was that WeWork had a perfect mixture for turnaround with over-pessimistic news headlines, under-appreciated structural shifts, optimism from industry experts and stakeholder alignment between SoftBank, landlords and new management.
New disclosures from the company have confirmed some aspects of our thesis:
- The WeWork turnaround plan appears to be on track. The company is balancing a lack of revenue with savings on expenses. It has saved $1.1B in SG&A, $200M+ from 200+ lease exits and amendments, and $400M from ongoing rent renegotiation.
- Broader acceptance of hybrid working is growing. Larger corporates are switching to WeWork as a viable option for flexibility. Enterprise revenue contribution has increased to 50% of total physical memberships. This percentage is skewed due to SMBs churning off but wider adoption of flexspace from enterprises is still evident.
- WeWork’s new product All-Access (“WAA”) improves asset turnover. The management expects that WWA will drive incremental margin expansion. Other asset light operations include the franchise business, in which the landlord provides the space and WeWork provides office design. However, the revenue contribution from this management fee is not material, only $5M in 2020.
Ultimately, WeWork is more well-positioned than traditional landlords in a hybrid working environment. It is also better positioned than most flex-space providers due to its large global footprints. Some investors are clearly optimistic about this, as WeWork’s bond price has recovered from 28 cents to 99.8 cents on the dollar, a 300%+ peak to trough over the last 10 months.
However, WeWork is still a cyclical, high risk, real estate business. $40B+ of operating leases remain unaccounted for in the capital structure in WeWork's SPAC deck, and the company has only $665M of cash on hand to deal with its significant interest expenses and capex. For WeWork to win, it will require fanatical execution not just on keeping costs low, but on growing and achieving high occupancy—and so far, the company has shown it can achieve either growth or higher occupancy, but not both.
Valuation: Why we think WeWork is overpriced (again) at $9B

WeWork SPAC DCF and Scenario Analysis
Members
Unlock NowUnlock this report and others for just $50/month
WeWork SPAC DCF and Scenario Analysis
Members
Unlock NowUnlock this report and others for just $50/month
Our view is that at $9B enterprise value or the $7.9B equity value, WeWork has fully priced in their future recovery, with ambitious long term occupancy forecasts on top of that.
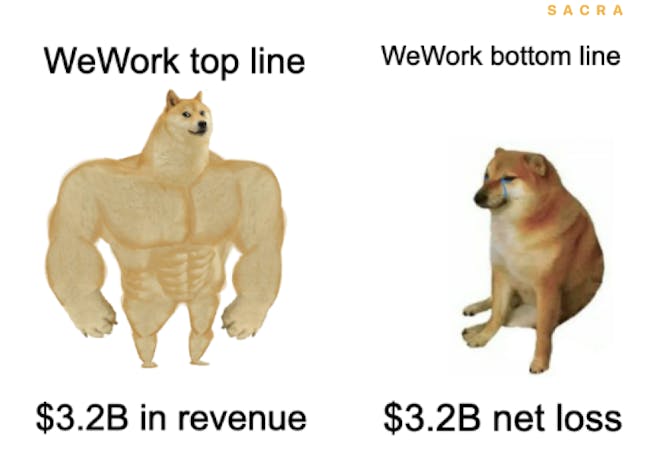
We valued WeWork at $3.5B equity value last December. The company's 2020 occupancy was 46%, or 15% lower than our assumption. This caused a higher cash burn than in our base case. The company went on to end the year with a $3.2B net loss, and management expects cash on balance to reduce from $3.6B in Q320 to $665M by Q221.
Why is WeWork raising cash now? It needs to pay for its interest expense and capex. We estimate WeWork pays $300M net interest expense per year and has at least $400M net capex requirement. In other words, the remaining $665M cash on the balance sheet wouldn’t be enough to cover one year of interest expense and capex.
In addition, the pro forma valuation in the WeWork SPAC deck isn't capitalizing its $40B+ operating leases (operating leases are a form of debt, so they should be included in the capital structure). If we include operating leases in enterprise value, it reduces equity value to zero. We believe WeWork has some option value—but one gives up a lot of upside paying $7.9B.
WeWork’s equity value is also highly sensitive to occupancy rate and the cost of capital. For example, a 5% drop in long term occupancy rate equals a 60% drop in equity value. This exposes WeWork to execution risks if the company is unable to achieve its guided revenue projection.
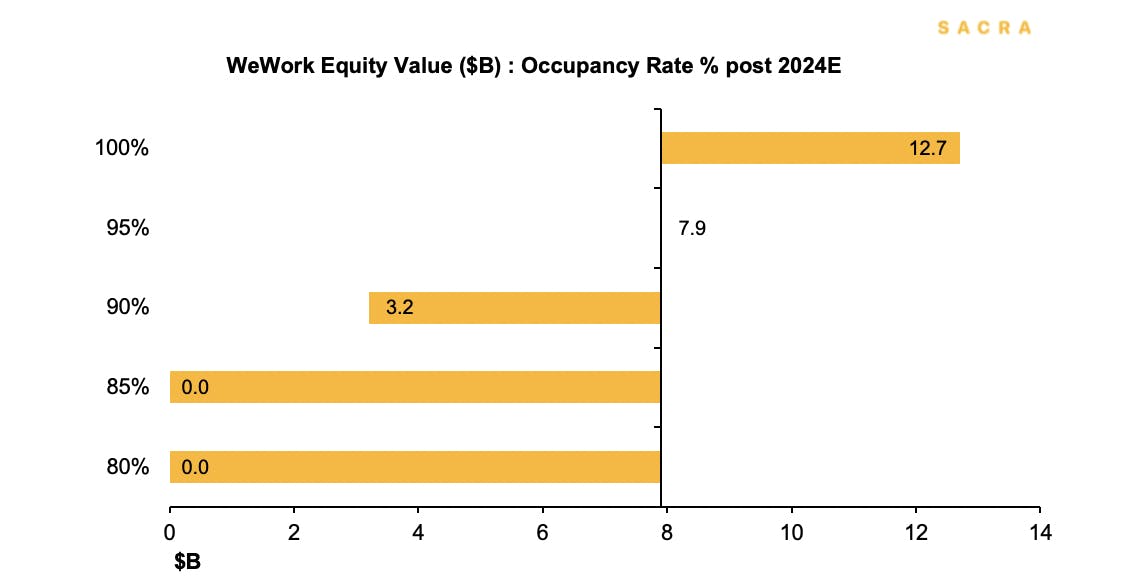
WeWork's equity value is highly sensitive to changes in long term occupancy rate.
It is almost a philosophical exercise to determine WeWork's cost of capital. If we capitalize operating leases, WeWork is 90%+ debt and <10% equity. Then, their cost of capital would be lower in the current low yield environment. However, the SPAC deck neglected the operating leases, flipping the debt to equity ratio and presenting the company as 90% equity and 10% debt.
To illustrate the difference, with a 10.5% cost of capital, a 1% increase in cost of capital creates a 30% drop in equity value.
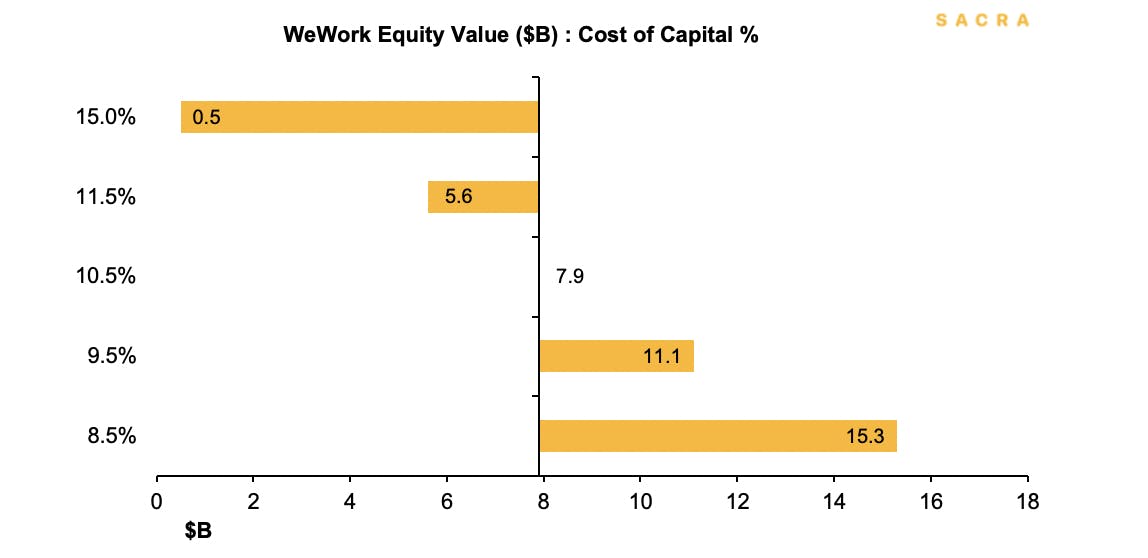
WeWork's equity value given different costs of capital.
If we sensitize both occupancy and the cost of capital, we get to the following mix of equity values in $B.
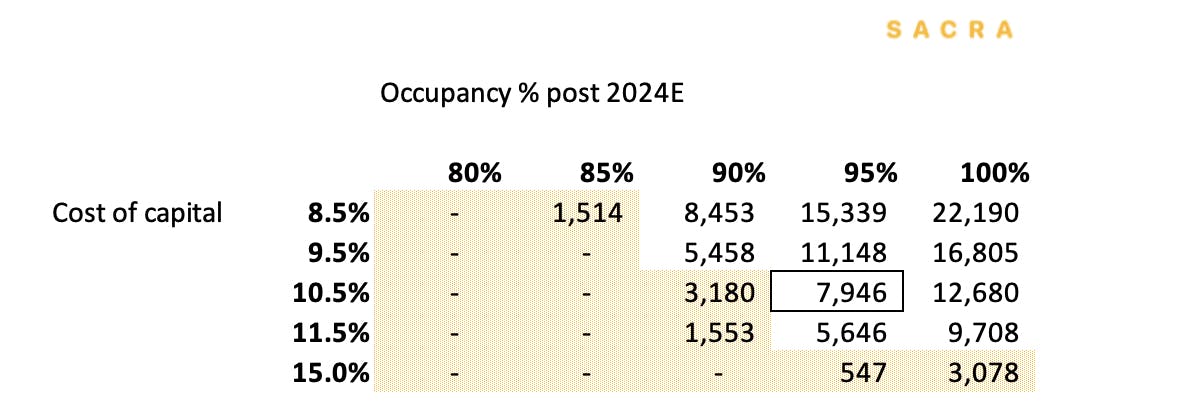
Sensitivity analysis of WeWork's equity value given different costs of capital and occupancy rates.
At $7.9B equity value assuming 95% occupancy post 2024E and 10.5% cost of capital, we believe WeWork has an unattractive risk-reward profile.
Updates: 3 changes in WeWork's SPAC deck
WeWork Revenue, Memberships and Workstations
Members
Unlock NowUnlock this report and others for just $50/month
WeWork Revenue, Memberships and Workstations
Members
Unlock NowUnlock this report and others for just $50/month
There were three notable changes in WeWork's March 2021 SPAC presentation:
- WeWork has dropped its estimated average contribution margin and now only shows contribution margin for mature locations
- New monthly membership product "All Access" shows positive uptake
- No mention of $47B in operating leases in the company's capital structure
These changes—more granular than disclosures shared in the company's S-1—make clear that WeWork has a nuanced business.
Firstly, commercial real estate is ultimately a cyclical industry. The long-term leases last for 15 to 20 years, which would cover potentially two or three real estate cycles. Last year was WeWork’s first economic downturn, it is just too early to conclude a cross-cycle contribution margin. Similar to cross-cycle contribution margin, in an ideal world, we’d want to look at the normalized occupancy across the cycle, i.e. the occupancy that, on average, can be maintained in the building.
WeWork estimates that the contribution margin on mature locations is 27%, but currently mature markets only account for 47% of the total revenue.
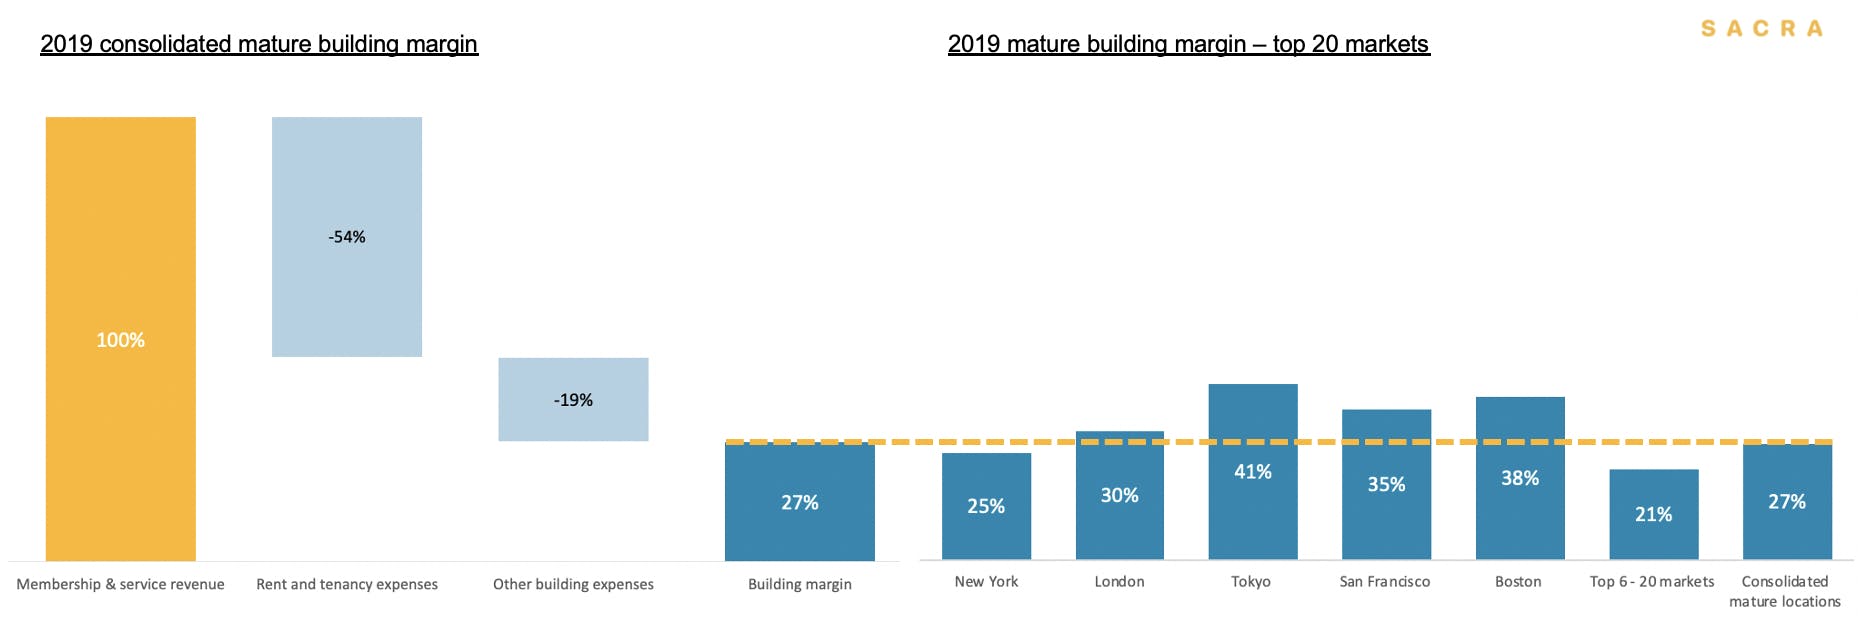
Source: WeWork March 2021 SPAC deck
Secondly, since 2020, WeWork has launched a new product called All Access. It leverages WeWork’s global footprint in 150 cities and over 850 offices. WeWork All Access (“WAA”) optimizes the fleet and improves the asset turnover of existing office space. Given the proximity of WeWork offices in city centers, WAA members can self-regulate and find vacant desks. Management projects a higher occupancy rate due to WAA and an additional revenue of $481M over the next three years.
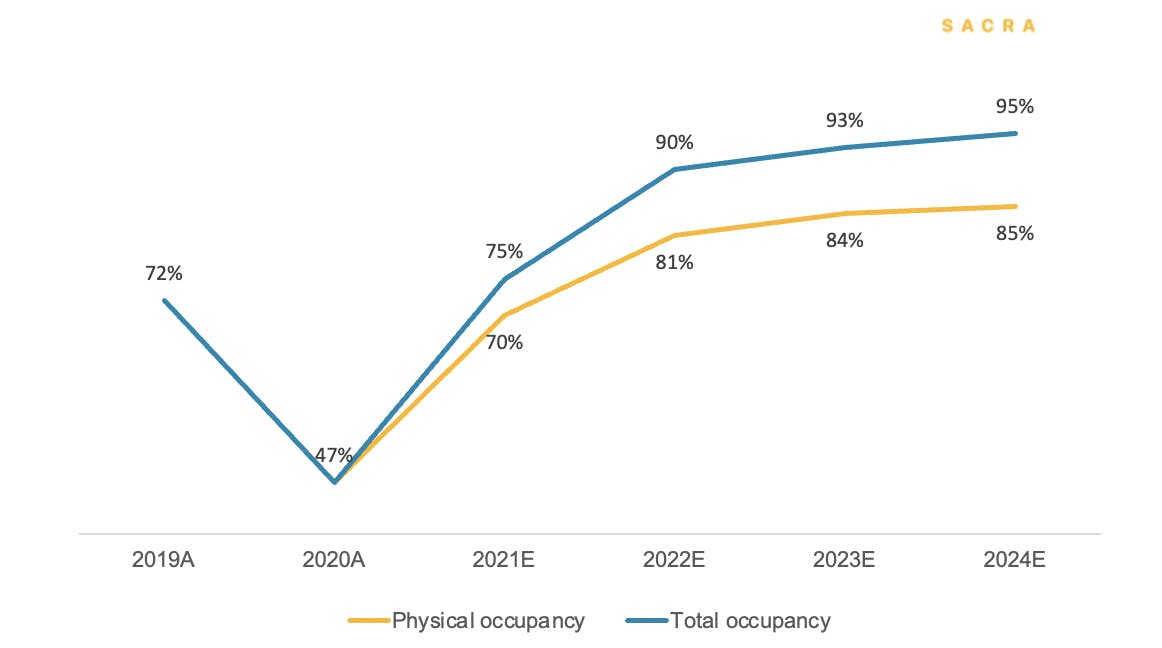
Nevertheless, an important nuance is that there are two types of occupancy in the flex space. Physical occupancy is the number of people who are actually in the building, and economic occupancy (undisclosed) is the percentage of income-generating members. During high demand, physical occupancy can be as high as 100%. Economic occupancy, however, never reaches 100% because some members are on a discounted membership, bringing down effective revenue. Relating back to the management’s projection, even if WeWork reaches 95% total occupancy with WAA, their economic occupancy could well be lower.
Thirdly, the SPAC deck makes no mention of WeWork’s operating leases. As of 2019, WeWork had signed $47B future lease commitments. Recent changes in lease accounting standards require companies to record operating leases on the balance sheet at the present value of future lease payments, and WeWork has not done so here.
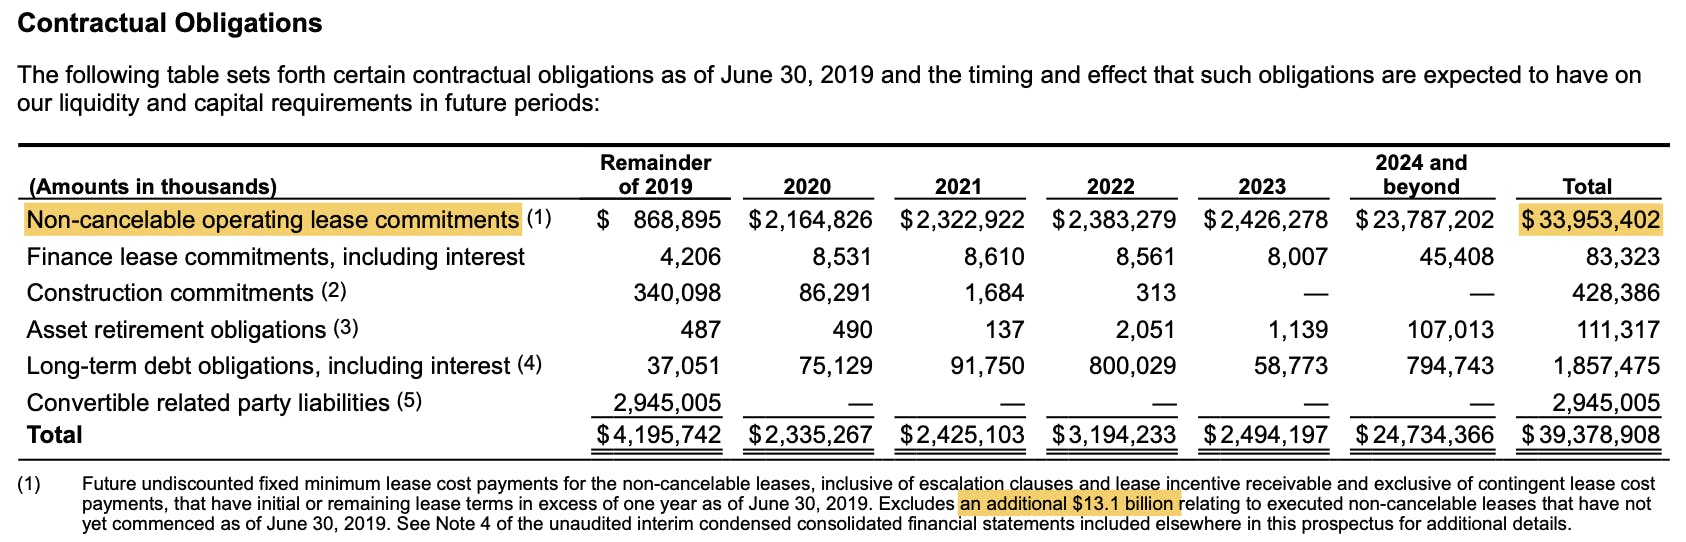
Source: WeWork S1 2019
We estimate $45B lease commitments were still outstanding at the beginning of 2020. Assuming WeWork managed to exit 10% of these leases last year, the balance would still be sizable.
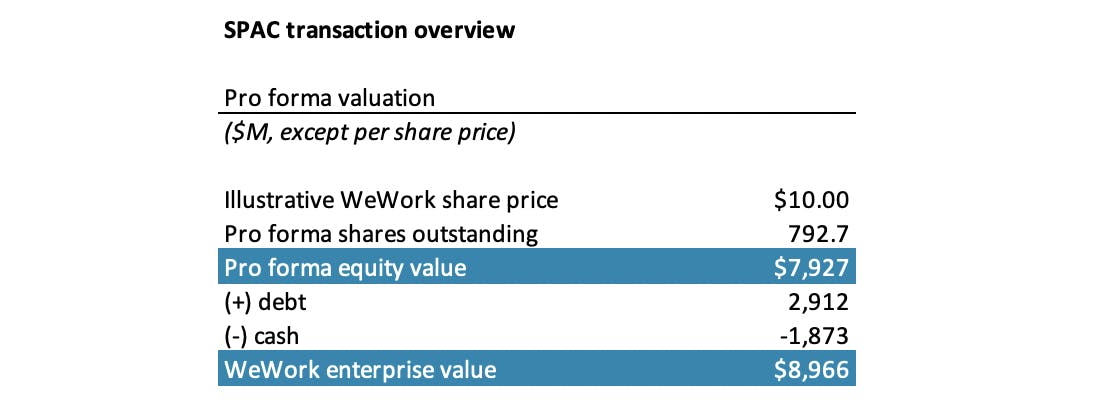
We believe the capital structure outlined in the SPAC deck is incomplete because the present value of leases needs to be added to total debt and deducted from enterprise value.
Analysis: WeWork’s strategy to survive the downturn appears to be working
Key to our earlier analysis of WeWork's turnaround strategy was the idea that WeWork could negotiate discounts or deferrals to help it stay in business through the pandemic.
Through our primary research, we've learned that some landlords have been very accepting of this given the current economic climate—and have been quite responsive to WeWork’s requests.
WeWork overall has been cooperative in dealing with landlords. WeWork’s biggest competitor IWG has been through a handful of economic downturns in the last 30 years, but every time, they had a very strained relationship with the landlords. Last year, Regus, who is one of IWG’s subsidiaries, threatened to file bankruptcy.
Since these flex space providers structure each of their asset as an SPV, during a downturn, Regus can just dissolve the SPVs, hand the lease back to the landlords and walk away. This has been a reason for landlords not looking favorably at flex space providers.
In contrast, under its new management, WeWork has aimed to work with landlords in a less adversarial way. From our research, we learned that WeWork is making sure it has the liquidity that is required to sustain itself in the short term. WeWork is treating landlords more like partners and prioritizing building trust and negotiating its way out of the pandemic.
That works for the landlords too, because if WeWork files bankruptcy and leaves, the landlord is also exposed to a vacant building in an extremely difficult economic climate.
This is a valuable lifeline for WeWork, which previously expected to operate at 60-70% occupancy and has seen that drop to 40-50%. Even though WeWork isn’t able to generate enough revenue, if it exits the building, the landlord would have a vacant building without rental income, meaning it is in the landlords’ interest to keep WeWork in the building.
Accumulating goodwill like this is critical for WeWork. The medium term impact of a more cooperative relationship with the landlords is that WeWork has a safety net. If reopening is further delayed in the long-term, WeWork can turn to the landlords for more rent deferrals.
The future of WeWork
In our December report on WeWork, we explained the path to profitability that we saw for the company—and how the company's new management had begun taking the steps necessary for a turnaround.
Since then, WeWork has continued to improve its governance, improve its cost discipline and improve its revenue mix. However, problems remain. Fundamentally, this is still a low margin, cyclical business with duration mismatch. We are cautiously optimistic about WeWork’s future—but the challenges and execution risks are far from over.
Appendix
Disclaimers
- Sacra has not received compensation from the company that is the subject of the research report.
- Sacra generally does not take steps to independently verify the accuracy or completeness of this information, other than by speaking with representatives of the company when possible.
- This report contains forward-looking statements regarding the companies reviewed as part of this report that are based on beliefs and assumptions and on information currently available to us during the preparation of this report. In some cases, you can identify forward-looking statements by the following words: “will,” “expect,” “would,” “intend,” “believe,” or other comparable terminology. Forward-looking statements in this document include, but are not limited to, statements about future financial performance, business plans, market opportunities and beliefs and company objectives for future operations. These statements involve risks, uncertainties, assumptions and other factors that may cause actual results or performance to be materially different. We cannot assure you that any forward-looking statements contained in this report will prove to be accurate. These forward-looking statements speak only as of the date hereof. We disclaim any obligation to update these forward-looking statements.
- This report contains revenue and valuation models regarding the companies reviewed as part of this report that are based on beliefs and assumptions on information currently available to us during the preparation of this report. These models may take into account a number of factors including, but not limited to, any one or more of the following: (i) general interest rate and market conditions; (ii) macroeconomic and/or deal-specific credit fundamentals; (iii) valuations of other financial instruments which may be comparable in terms of rating, structure, maturity and/or covenant protection; (iv) investor opinions about the respective deal parties; (v) size of the transaction; (vi) cash flow projections, which in turn are based on assumptions about certain parameters that include, but are not limited to, default, recovery, prepayment and reinvestment rates; (vii) administrator reports, asset manager estimates, broker quotations and/or trustee reports, and (viii) comparable trades, where observable. Sacra’s view of these factors and assumptions may differ from other parties, and part of the valuation process may include the use of proprietary models. To the extent permitted by law, Sacra expressly disclaims any responsibility for or liability (including, without limitation liability for any direct, punitive, incidental or consequential loss or damage, any act of negligence or breach of any warranty) relating to (i) the accuracy of any models, market data input into such models or estimates used in deriving the report, (ii) any errors or omissions in computing or disseminating the report, (iii) any changes in market factors or conditions or any circumstances beyond Sacra’s control and (iv) any uses to which the report is put.
- This research report is not investment advice, and is not a recommendation or suggestion that any person or entity should buy the securities of the company that is the subject of the research report. Sacra does not provide investment, legal, tax or accounting advice, Sacra is not acting as your investment adviser, and does not express any opinion or recommendation whatsoever as to whether you should buy the securities that are the subject of the report. This research report reflects the views of Sacra, and the report is not tailored to the investment situation or needs of any particular investor or group of investors. Each investor considering an investment in the company that is the subject of this research report must make its own investment decision. Sacra is not an investment adviser, and has no fiduciary or other duty to any recipient of the report. Sacra’s sole business is to prepare and sell its research reports.
- Sacra is not registered as an investment adviser, as a broker-dealer, or in any similar capacity with any federal or state regulator.
...