
WeWork Scenario Analysis, Risks, and Funding History
 Nan Wang
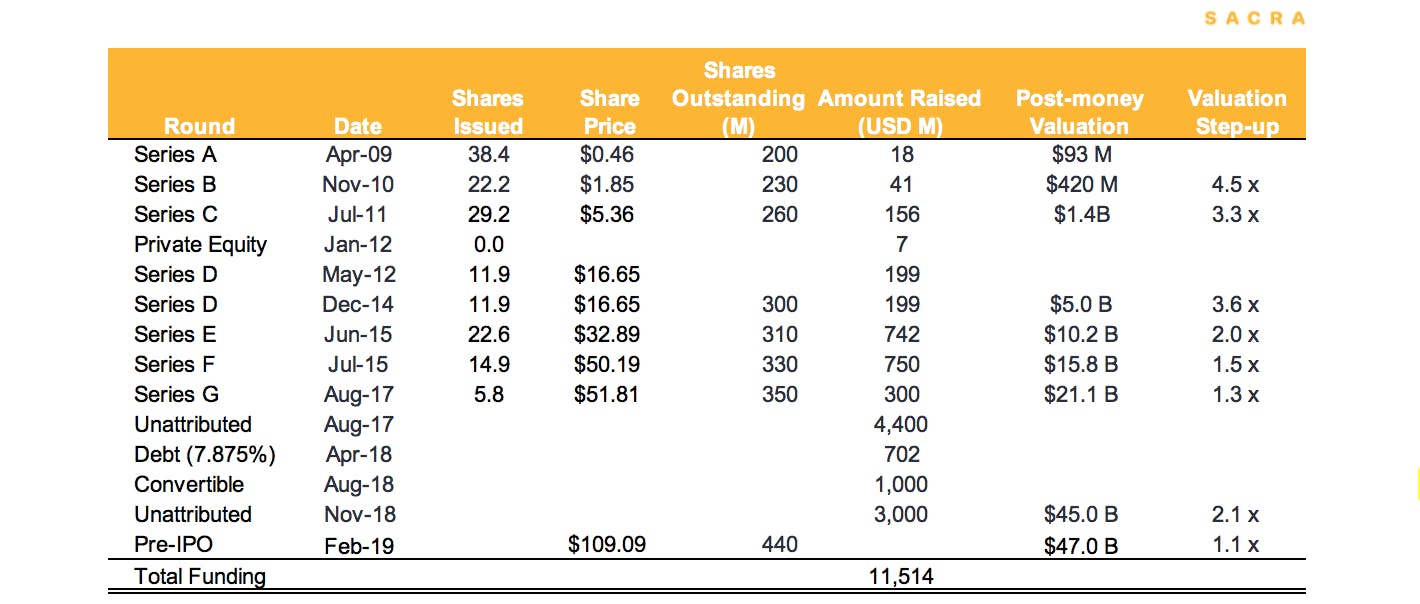
Funding and valuation history
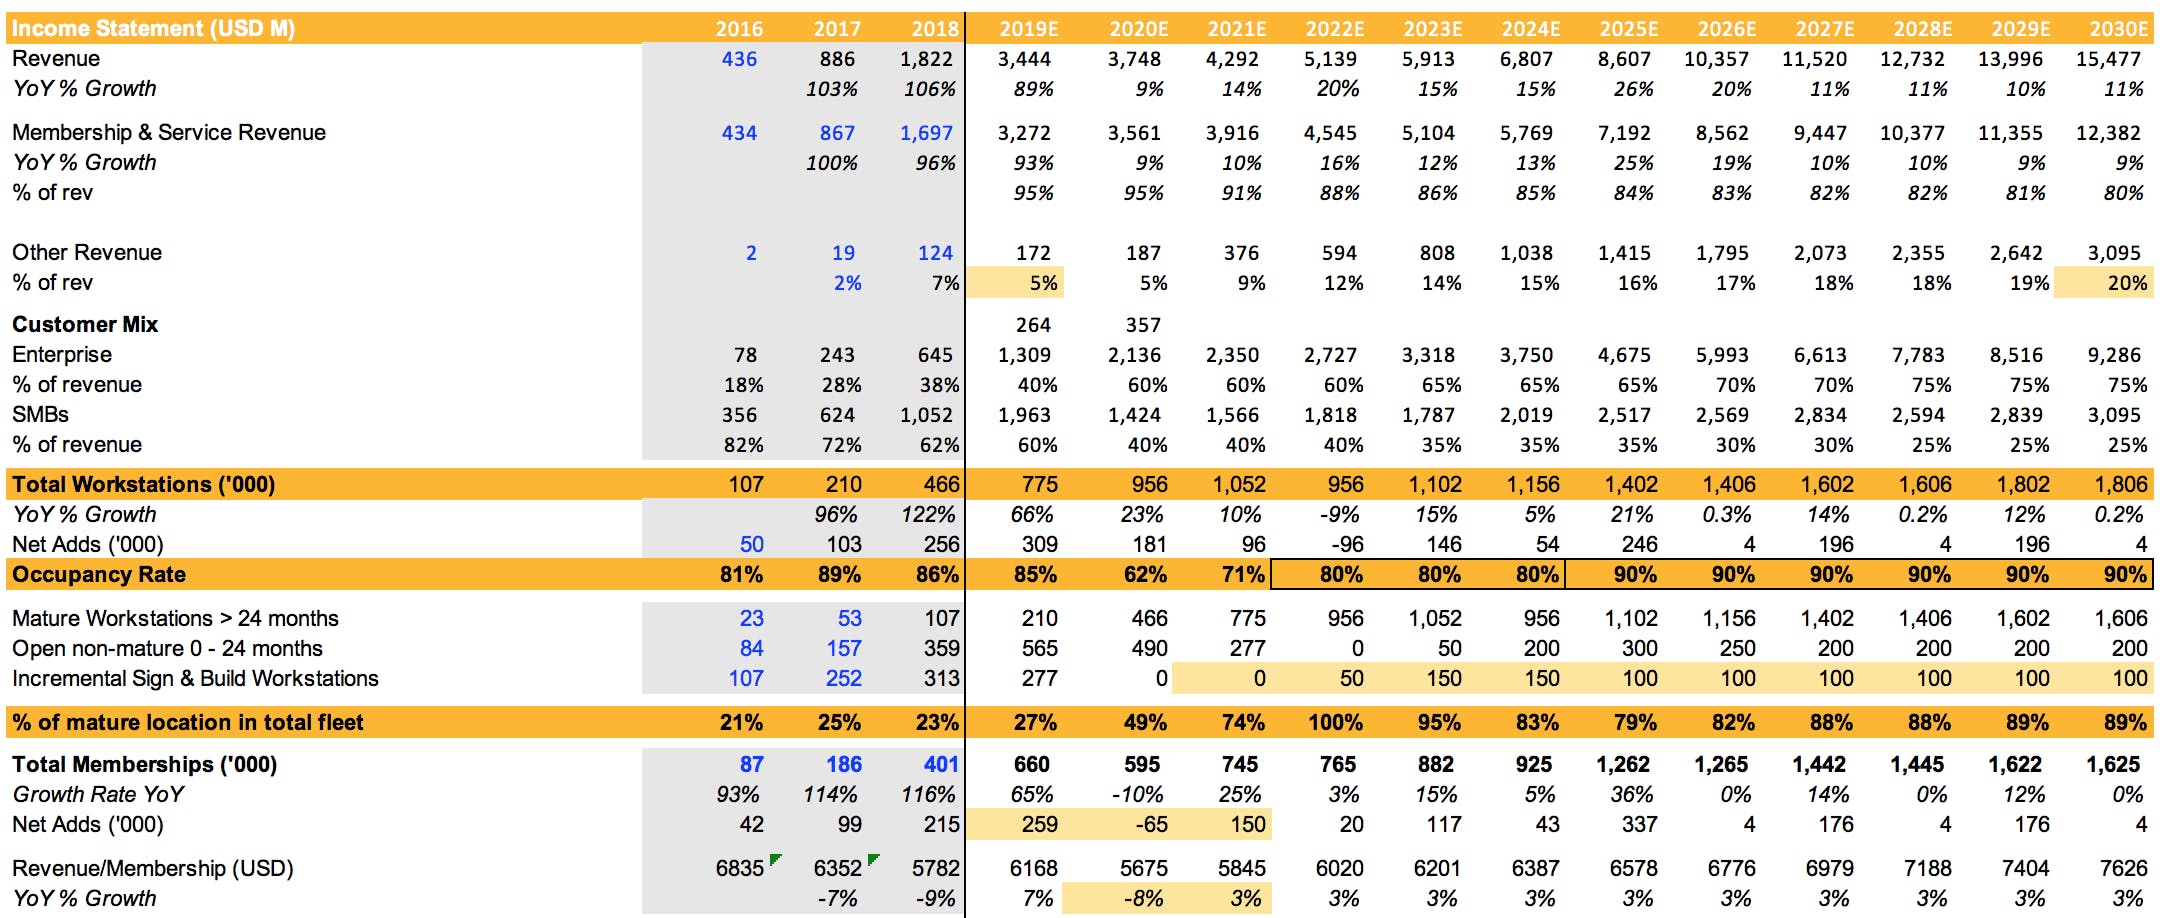
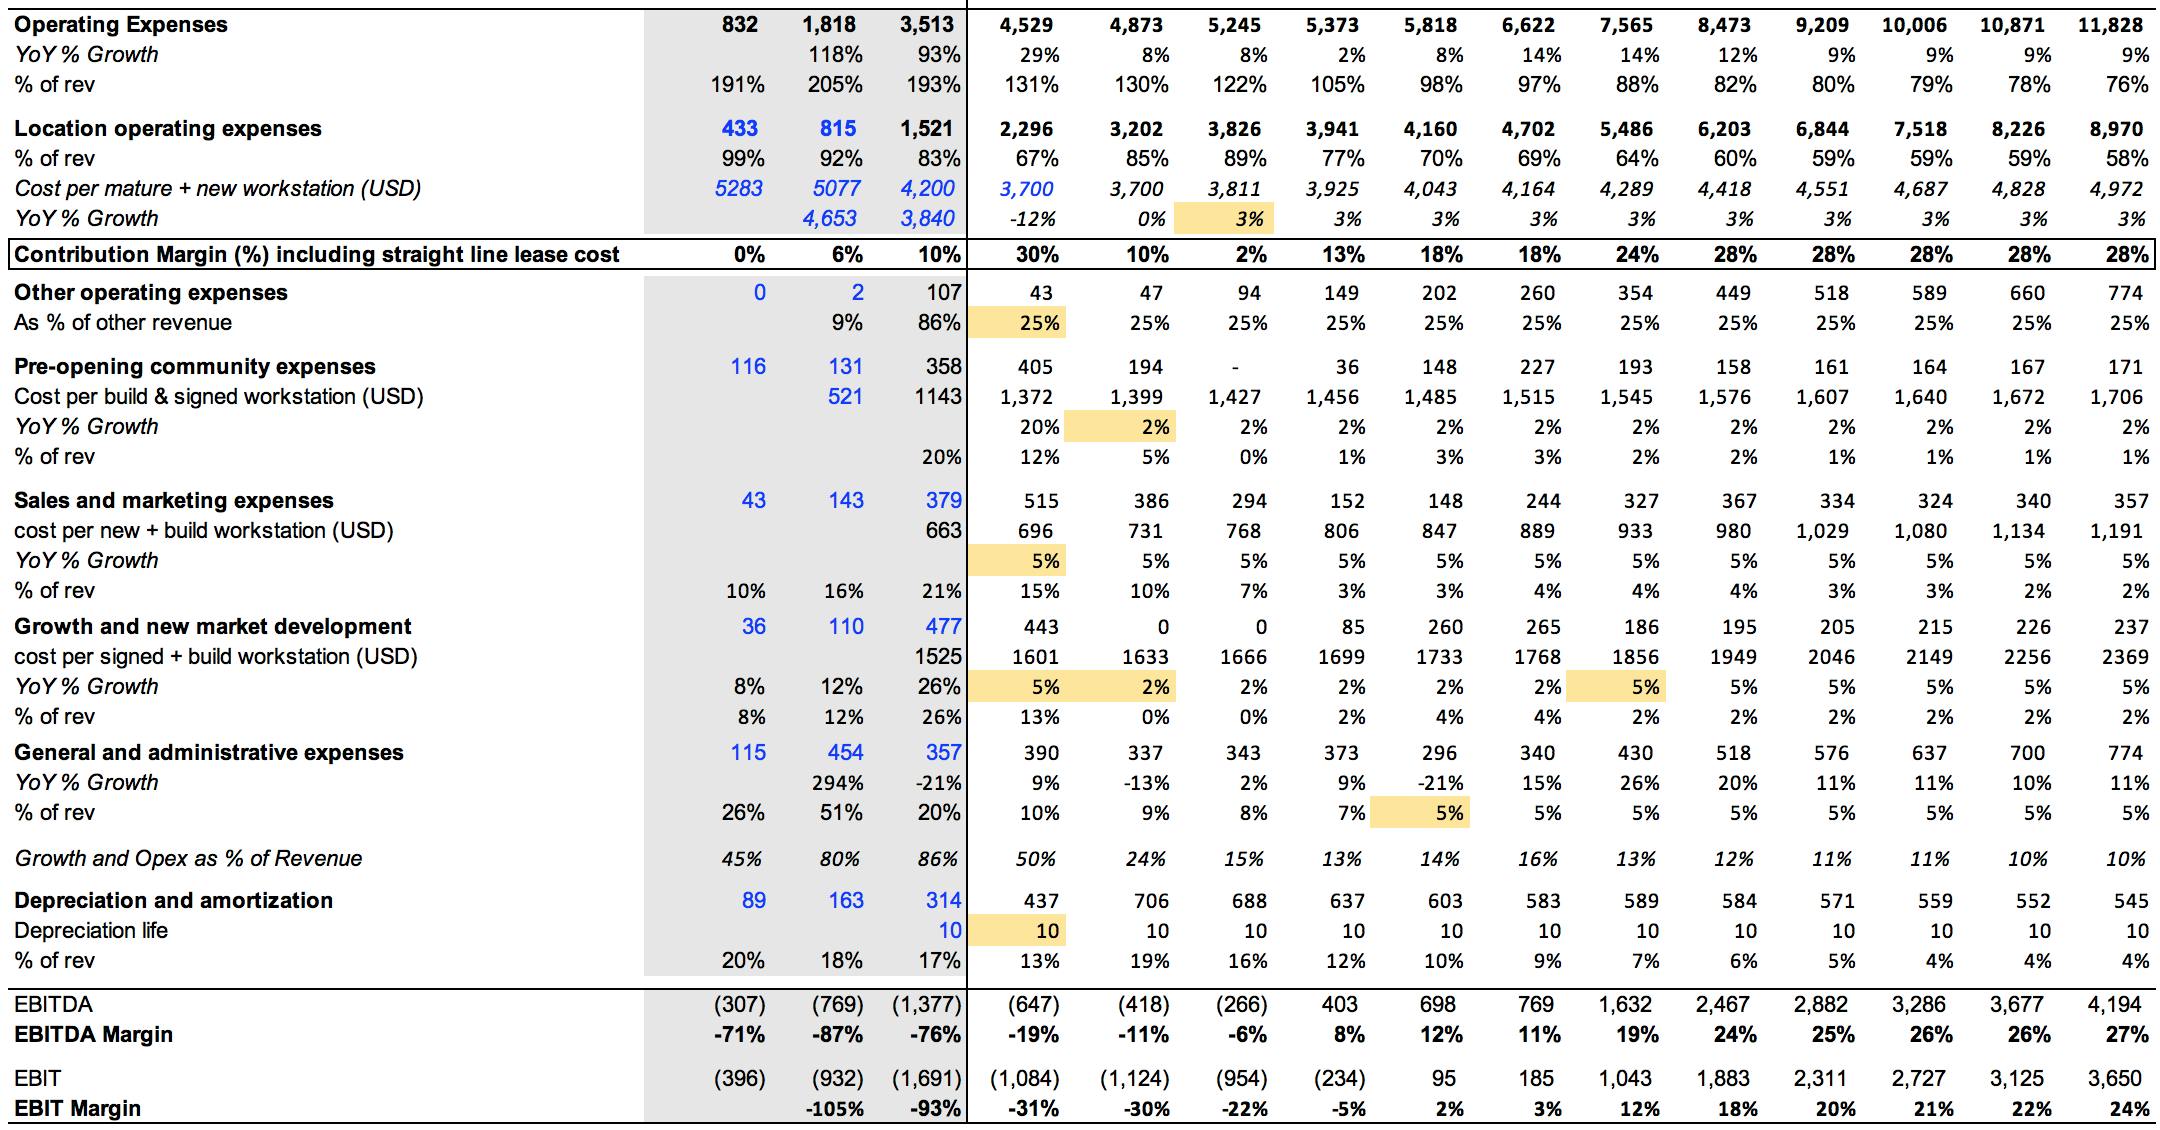
WeWork financials
Site-level unit economics
Using our estimated 2021 revenue per member, applying 20% contribution margin and 21% tax rate, the return on capital of a site operating at 90% occupancy is 22% and increases to 27% if occupancy and margin improve.
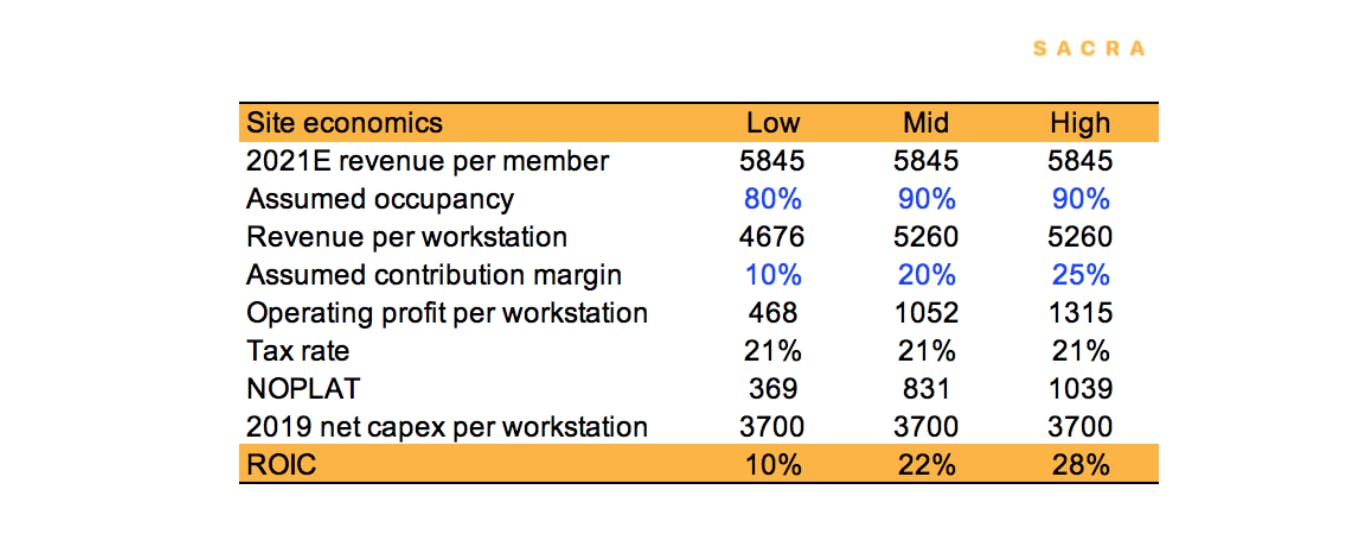
Site-level unit economics suggest that double digital return on capital is achievable with 80% occupancy and 10% contribution margin.
Illustrative contribution margin improvement post asset disposal
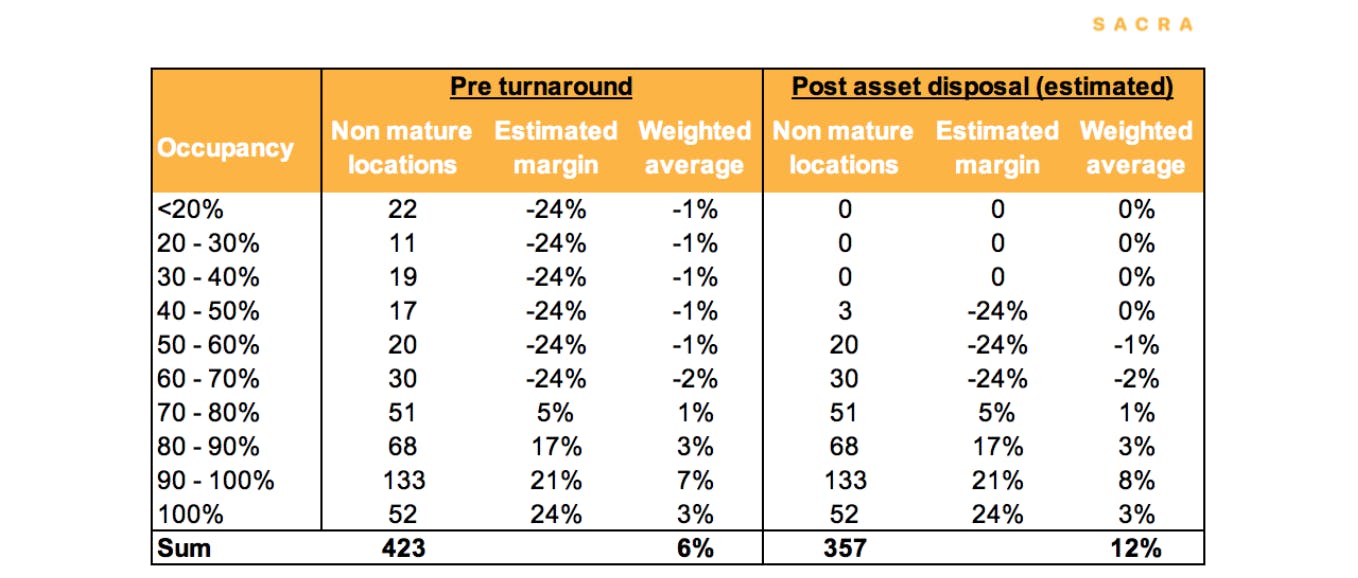
To sense check on how much contribution margin can benefit from terminating lower quality sites, here is our illustrative calculation. WeWork announced that they exited 66 locations. Without the 66 locations with the lowest occupancy, the contribution margin would improve from 6% to 12% across the non-mature portfolio.
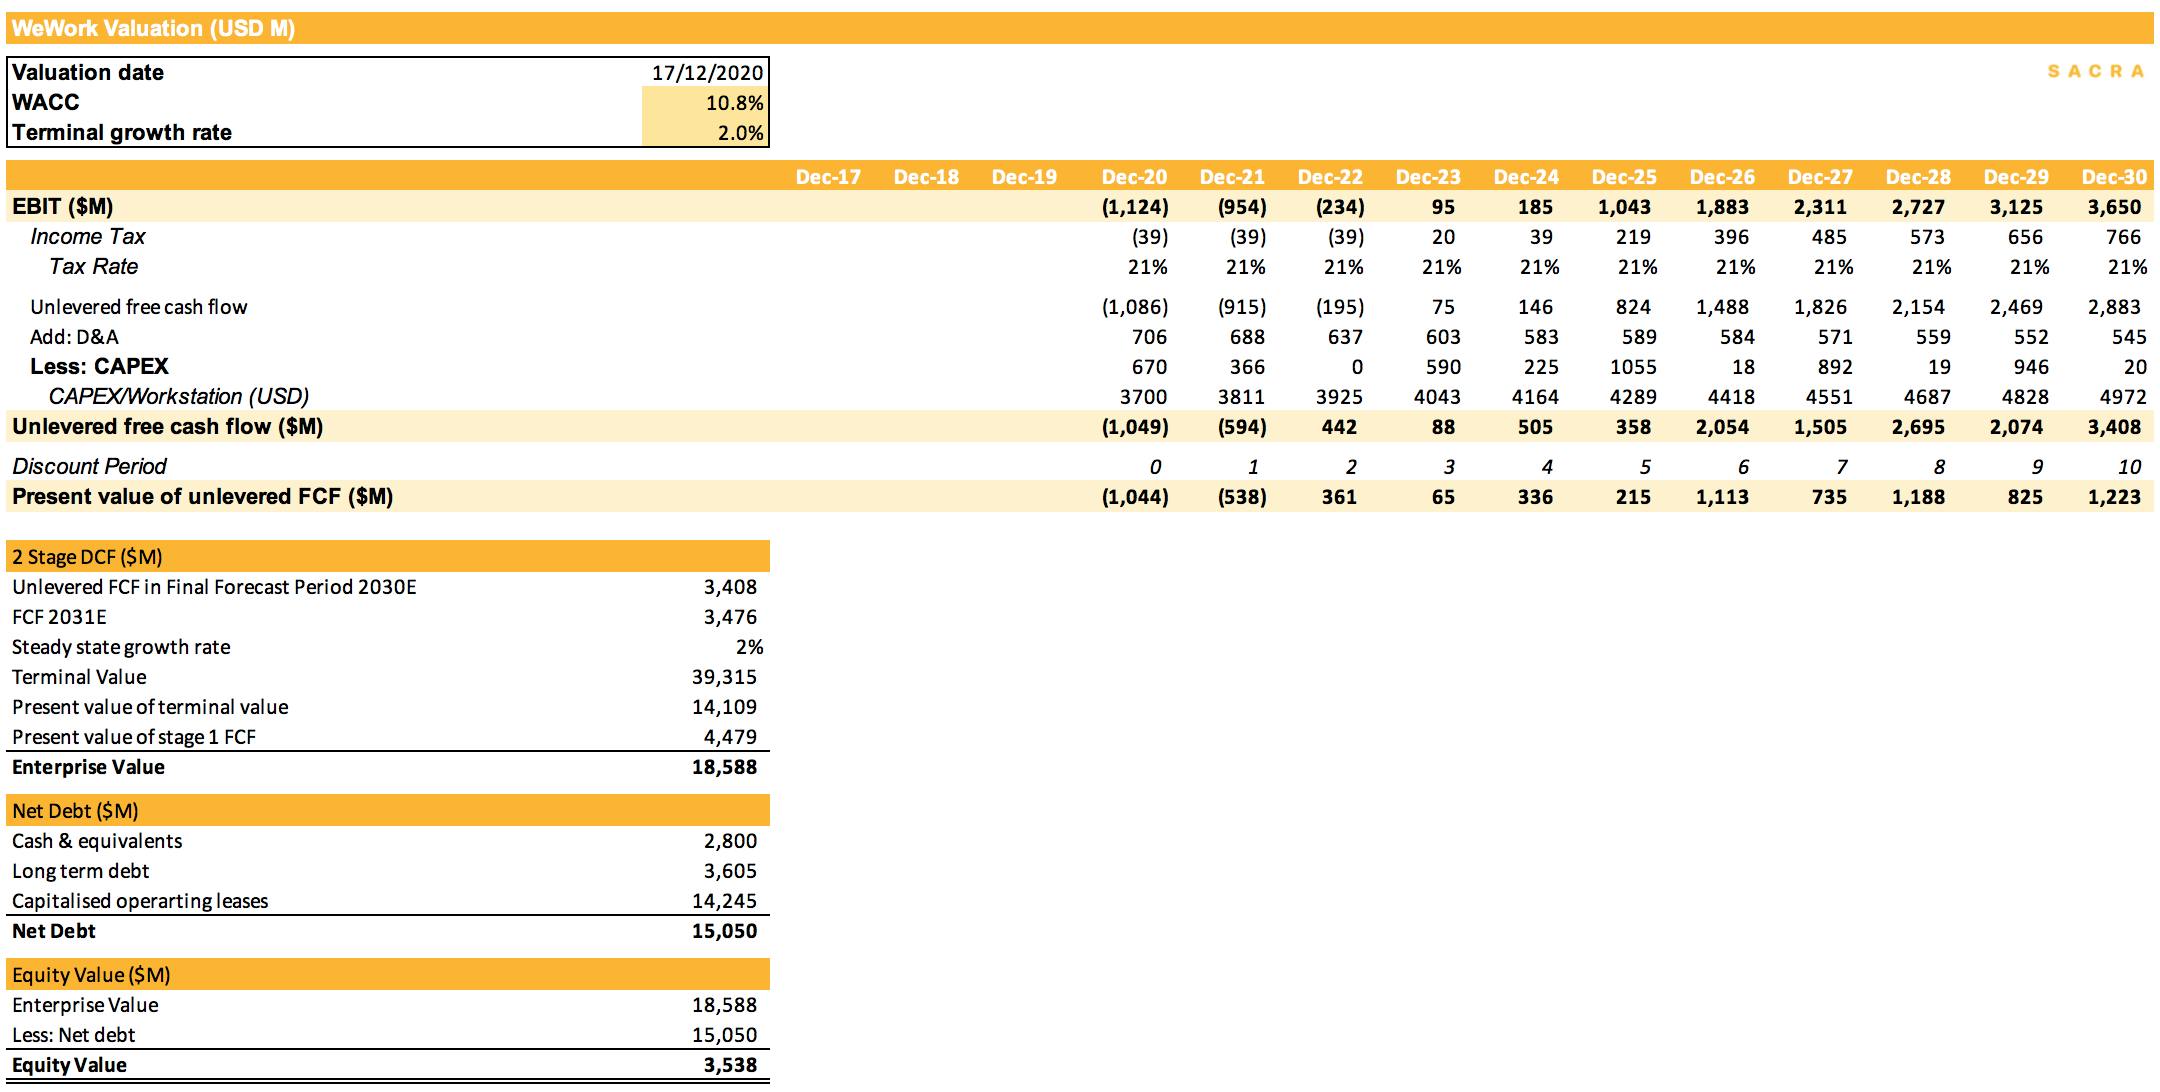
Discounted cash flow model
Our DCF is based on the following key assumptions.
Near term office demand: There is no doubt COVID has affected the company’s turnaround timeline. Our base case assumes that workspace demand will return to pre-COVID level in summer 2021.
Total workstations: WeWork doubled its total workstations between 2016 and 2019. As a result, mature locations accounted for only c.30% of the overall portfolio. To preserve cash and streamline the portfolio, the pace of expansion has slowed significantly. The base case assumes total workstations grow at 5% p.a to reach 1.2M by 2024.
Membership: The base case assumes that membership increases by 12% p.a. to reach 925K in 2024. This implies an occupancy rate of 80% in 2024.
Revenue per membership is assumed to grow at 3% in line with inflation, which may be conservative if inflation expectations are higher going forward due to several trillion dollars printed this year by global governments.
Contribution margin profile: As a large portion of the portfolio becomes mature, utilization rate improves and so does contribution margin. The management believes the contribution margin will trend to 30% in the long term. The base case assumes the contribution margin to reach 18% in 2024, then gradually trending up to 30% by 2030.
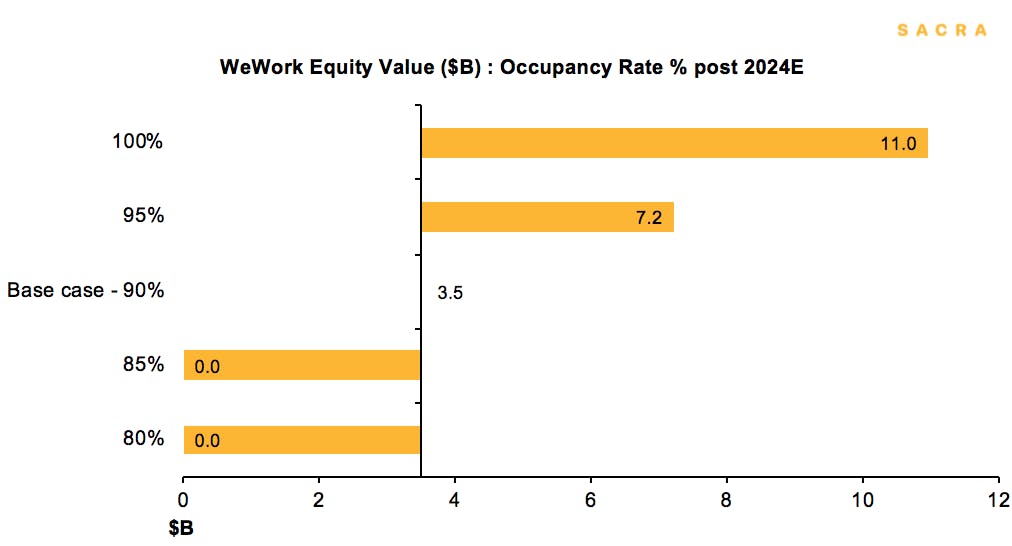
Scenario analysis
Scenario analysis shows that the business model is highly sensitive to the occupancy rate, a 5% drop in occupancy rate equals a $3B loss of equity value.
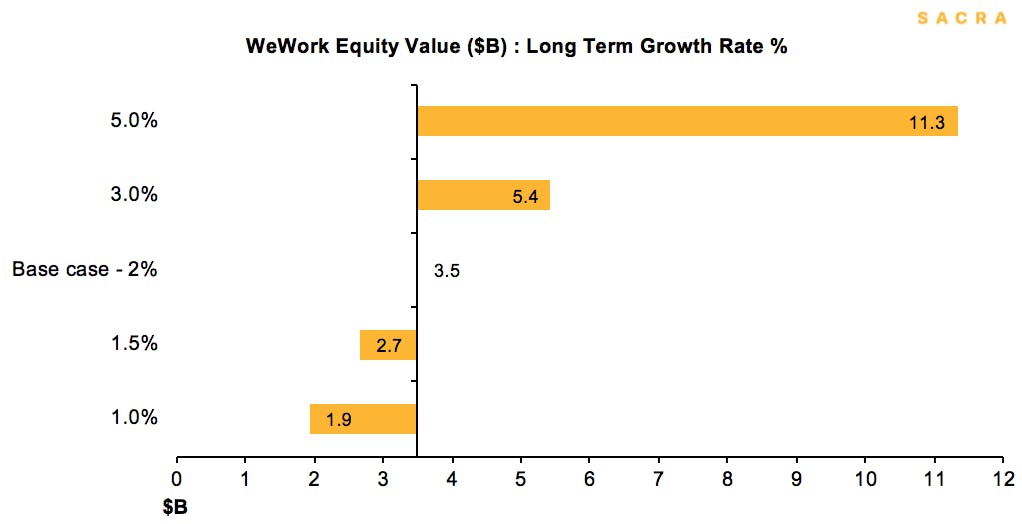
Our model assumes a 15% revenue CAGR from 2021 to 2030, followed by the long-term growth rate converging to GDP growth. If the shift to flexible working is adopted widely by corporates and SMBs, it would support higher growth. An increase in terminal growth rate from 2% to 3% translates to a 50% increase in equity value.
The cost of capital is a big driver of the business. Our base case applies a 10.8% cost of capital. A cheaper source of capital of 8% translates to an equity value of $17.5B.
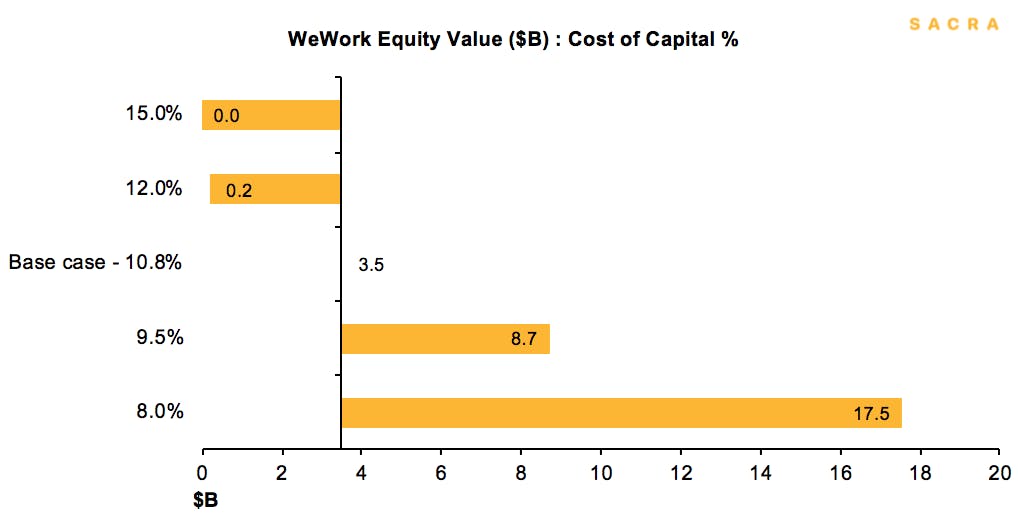
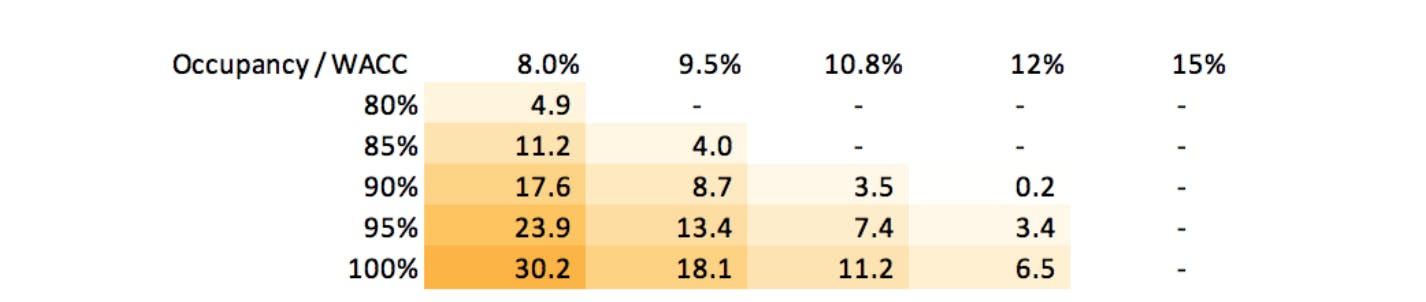
If we sensitize both occupancy and the cost of capital, we get to the following mix of equity values in $B.
Risks
Macro uncertainties: WeWork’s near-term performance is driven by many macro, dynamic factors, such as COVID, preferred working practice, people’s comfort towards going back to shared space, people’s attitude towards using public transportation, the health of the economy and employment level. These will take time to unfold.
Geographic concentration: Related to macro and unemployment risks, WeWork also has geographic concentration risk. The US contributed 60% of the revenue in 2018. New York City, San Francisco, Los Angeles, Washington D.C. and Boston are the top locations, where WeWork has 30 - 50% of the flex market. Declines in economic conditions and/or real estate activities in these cities would put pressure on WeWork’s earnings.
Lease obligations: WeWork is acutely sensitive to the commercial real estate market. WeWork has tied itself to property deals that were at the top of the cycle. Some of that rent burden stems from the company’s willingness to pay above market rents in order to grow as quickly as possible. The company had $47B non-cancellable operating lease commitments. It is unclear to what extent WeWork is able to restructure these contracts.
Liquidity risk: WeWork has $3.3B outstanding debt from SoftBank and $3.6B cash on the balance sheet as of Q320. The company is currently losing $1.5 - 2B per year. Therefore, to support location expansion, additional capital is required for CapEx. SoftBank is the majority shareholder as well as the largest credit provider. There is a risk that SoftBank no longer wants to be overexposed to WeWork and other financial institutions refrain from providing WeWork capital.
Changing in competitive dynamics: The industry as a whole, could offer cheaper and more flexible lease terms. Firstly, to save costs on fit-outs, enterprise customers would either migrate to WeWork, or the office design industry will start to propose more cost-effective fit-outs for their clients. Secondly, the rapid growth in flexible workspaces puts pressure on some landlords to offer shorter-term leases (of 2-5 years) to meet demand. Such offerings could absorb the incremental flexible workspaces customers.
This report contains forward-looking statements regarding the companies reviewed as part of this report that are based on beliefs and assumptions and on information currently available to us during the preparation of this report. In some cases, you can identify forward-looking statements by the following words: “will,” “expect,” “would,” “intend,” “believe,” or other comparable terminology. Forward-looking statements in this document include, but are not limited to, statements about future financial performance, business plans, market opportunities and beliefs and company objectives for future operations. These statements involve risks, uncertainties, assumptions and other factors that may cause actual results or performance to be materially different. We cannot assure you that any forward-looking statements contained in this report will prove to be accurate. These forward-looking statements speak only as of the date hereof. We disclaim any obligation to update these forward-looking statements.