Revenue
$1.89B
2021
Valuation
$2.60B
2022
Funding
$708.00M
2022
Growth Rate (y/y)
44%
2022
Valuation: $2.60B in 2022

Note: All figures for private companies estimated as per publicly available data. All figure for public companies taken from public filings.
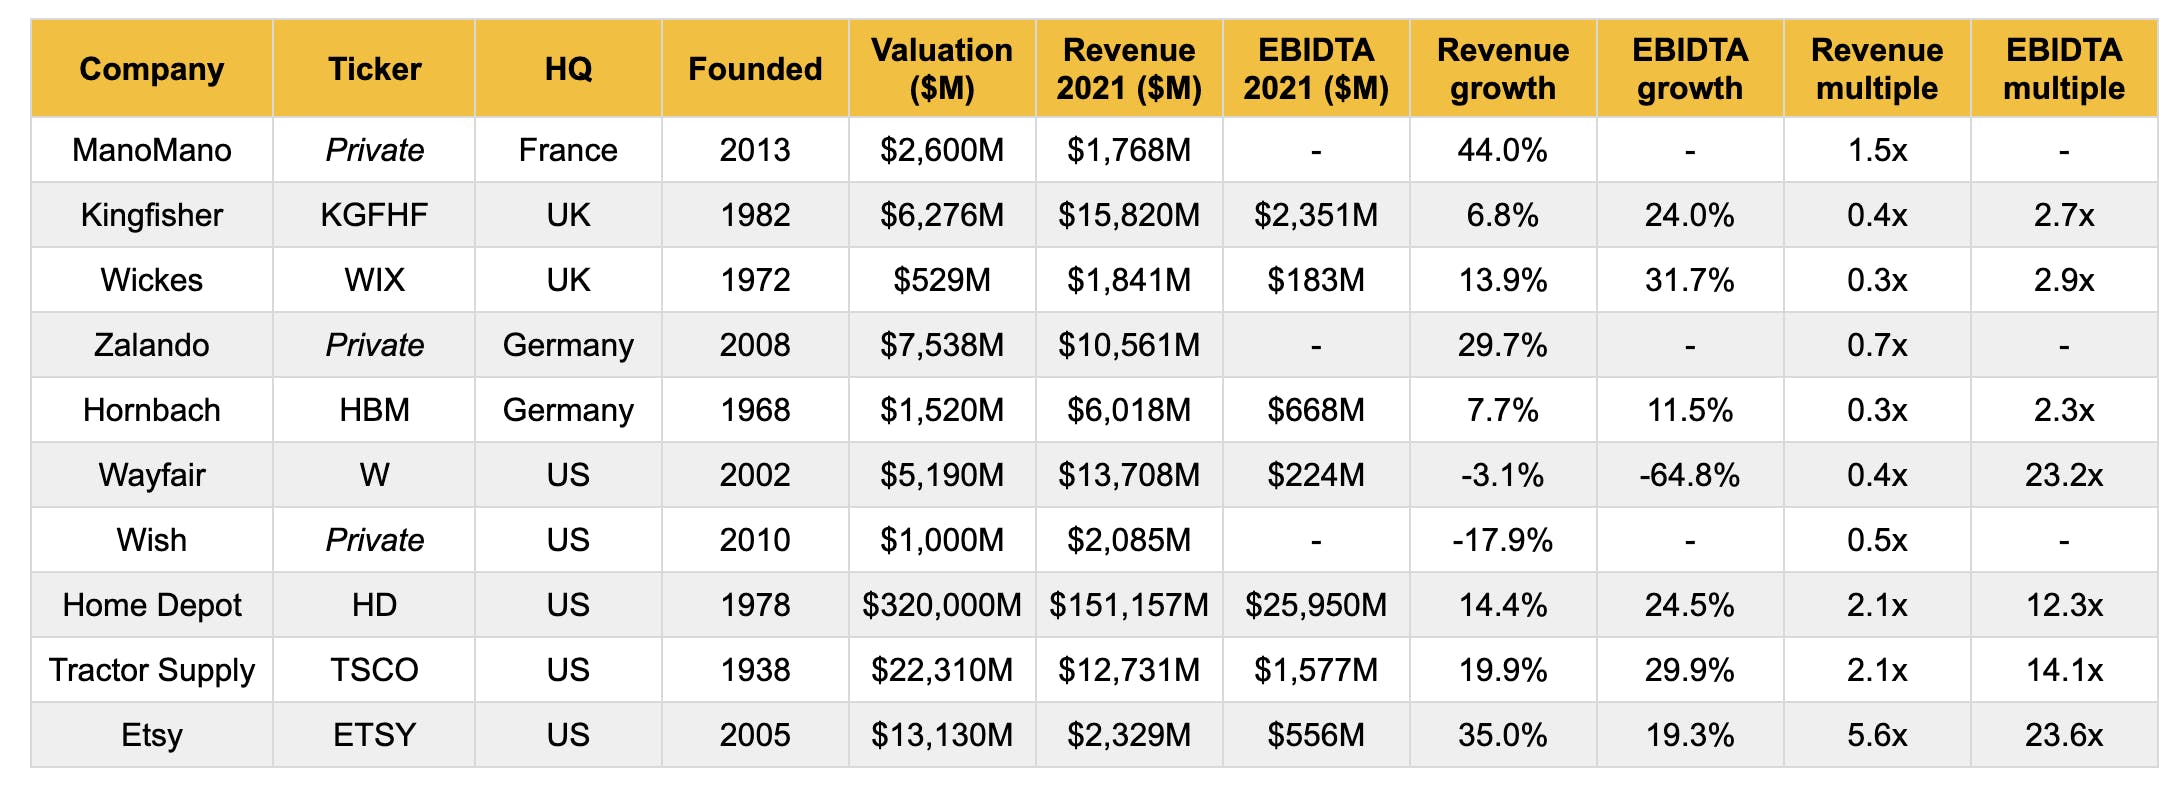
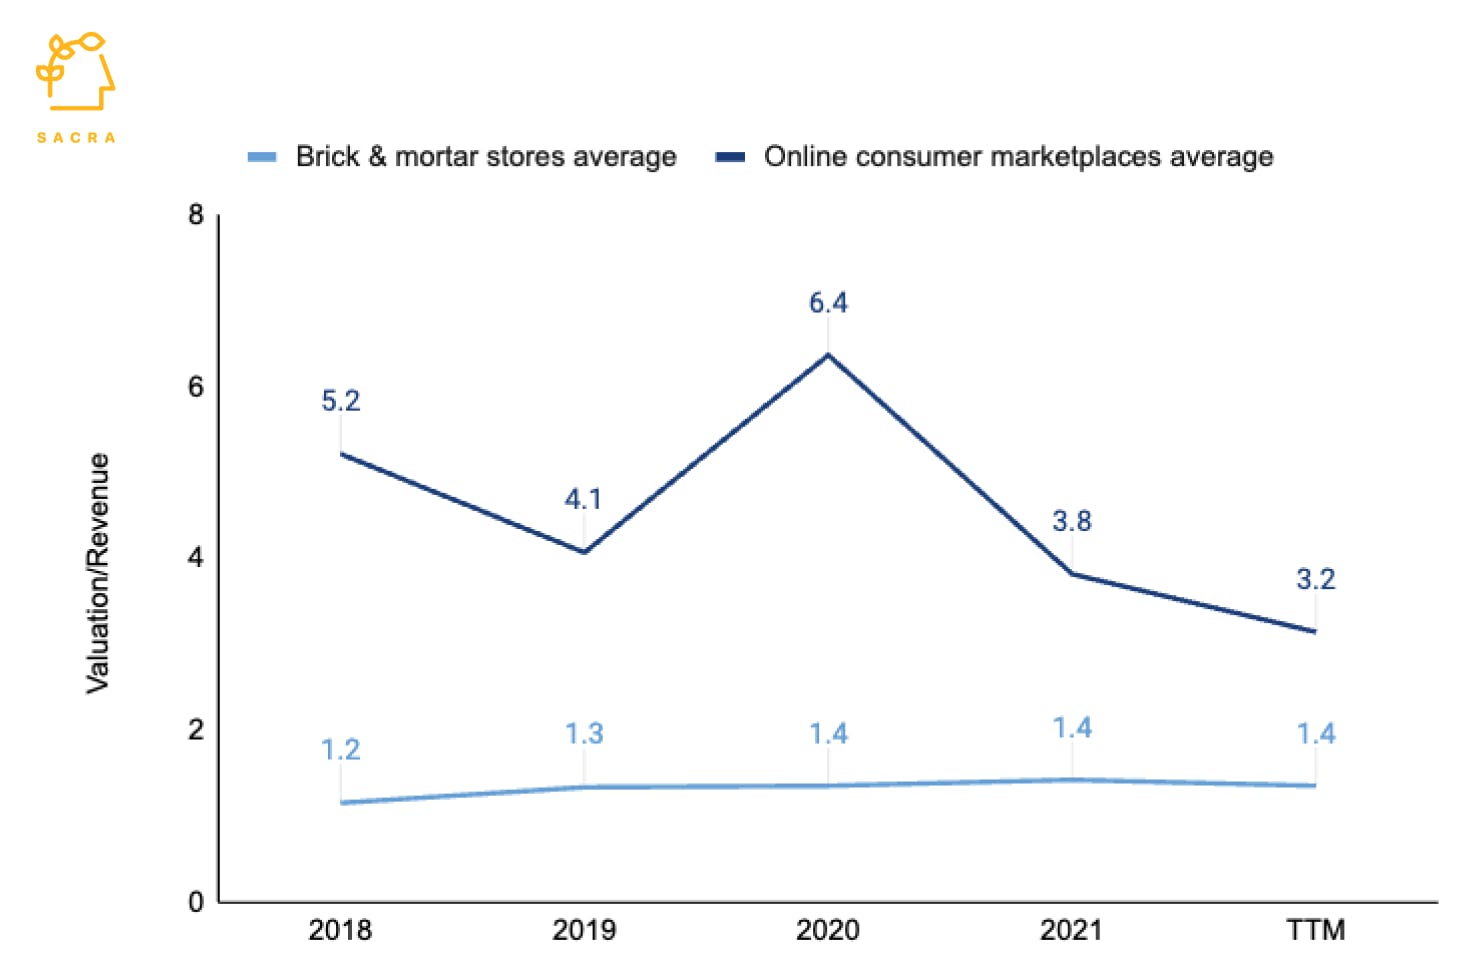
ManoMano has raised $708M from investors like General Atlantic, Dragoneer, and Temasek. It was last valued at $2.6B on a valuation/revenue multiple of 1.5x. ManoMano's revenue multiple comes in slightly above those of most other publicly listed DIY companies in Europe and the US, which have multiples less than 1x—though ManoMano is also growing the fastest out of all our comps. The revenue multiple for the brick and mortar DIY stores category has hovered around 1.4x over the last few years, however, the average multiple of online consumer marketplaces has dropped to 3.2x, from a high of 6.4x in 2020. When compared to the other online consumer marketplaces, ManoMano at 1.5x looks more attractively valued for future investors.


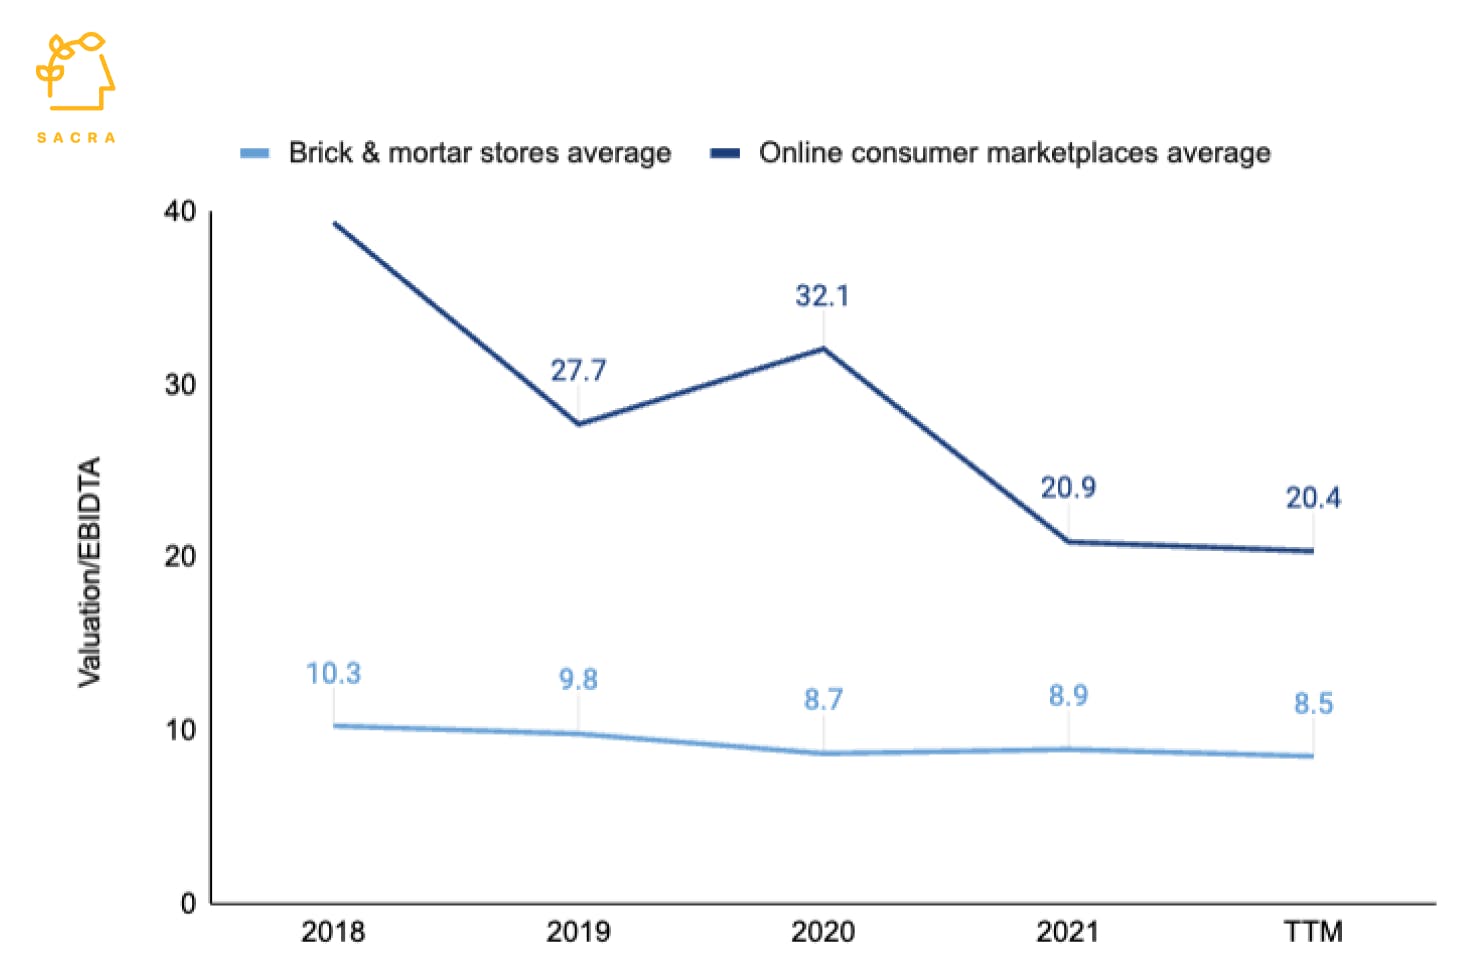
Note: Brick and mortar stores category includes Kingfisher brands, Hornbach, Home Depot, Tractor Supply, and Lowe’s. Online consumer marketplaces include Etsy, Ebay, Amazon, and Wayfair.
Scenarios: $4.9B to $20.8B ARR by 2026
To evaluate ManoMano's future potential, we've modeled several scenarios projecting the company's growth through 2026. These scenarios consider various growth rates and revenue multiples, taking into account both traditional DIY retail benchmarks and online marketplace valuations in the current market environment.
| 2021 Revenue ($M) | $1,889M | ||
|---|---|---|---|
| 2021 Growth Rate (%) | 44.43% |
ManoMano achieved $1.89B in revenue for 2021, with impressive 44.43% year-over-year growth, demonstrating strong momentum in the European DIY ecommerce market. This growth rate significantly outpaces traditional brick-and-mortar competitors, though it represents a return to pre-COVID growth levels.
| Multiple | Valuation |
|---|---|
| 1x | $1.9B |
| 5x | $9.4B |
| 10x | $18.9B |
| 15x | $28.3B |
| 25x | $47.2B |
Based on ManoMano's 2021 revenue of $1.89B, potential valuations span from $1.9B at a conservative 1x multiple to $47.2B at an aggressive 25x multiple. The company's current $2.6B valuation at 1.5x suggests room for significant upside if it can achieve multiples closer to other online marketplaces.
| 2026 Growth Rate | 2021 | 2022 | 2023 | 2024 | 2025 | 2026 |
|---|---|---|---|---|---|---|
| 10.0% | $1.9B | $2.6B | $3.2B | $3.9B | $4.4B | $4.9B |
| 15.0% | $1.9B | $2.6B | $3.3B | $4.1B | $4.9B | $5.6B |
| 20.0% | $1.9B | $2.6B | $3.4B | $4.4B | $5.4B | $6.4B |
| 30.0% | $1.9B | $2.7B | $3.6B | $4.9B | $6.4B | $8.4B |
| 45.0% | $1.9B | $2.7B | $4B | $5.7B | $8.3B | $12B |
| 50.0% | $1.9B | $2.8B | $4.1B | $6B | $9B | $13.5B |
| 55.0% | $1.9B | $2.8B | $4.2B | $6.3B | $9.7B | $15.1B |
| 65.0% | $1.9B | $2.8B | $4.4B | $7B | $11.4B | $18.7B |
| 70.0% | $1.9B | $2.9B | $4.5B | $7.3B | $12.2B | $20.8B |
Revenue projections through 2026 show potential outcomes ranging from $4.9B at a conservative 10% growth rate to $20.8B at an aggressive 70% growth rate. This represents significant upside from 2021's $1.9B revenue, particularly if ManoMano can maintain its strong growth trajectory.
| 2026 Growth Rate | 1x | 5x | 10x | 15x | 25x |
|---|---|---|---|---|---|
| 10.0% | $4.9B | $24.3B | $48.6B | $72.9B | $121.6B |
| 15.0% | $5.6B | $28B | $56B | $84.1B | $140.1B |
| 20.0% | $6.4B | $32.1B | $64.3B | $96.4B | $160.7B |
| 30.0% | $8.4B | $41.8B | $83.5B | $125.3B | $208.8B |
| 45.0% | $12B | $60.2B | $120.3B | $180.5B | $300.8B |
| 50.0% | $13.5B | $67.5B | $135B | $202.5B | $337.5B |
| 55.0% | $15.1B | $75.5B | $151B | $226.5B | $377.5B |
| 65.0% | $18.7B | $93.7B | $187.4B | $281.2B | $468.6B |
| 70.0% | $20.8B | $104B | $208B | $312.1B | $520.1B |
Projected 2026 valuations range from $4.9B at the most conservative scenario (10% growth, 1x multiple) to $520.1B in the most aggressive case (70% growth, 25x multiple), highlighting significant potential upside from ManoMano's current $2.6B valuation if strong growth continues.
Bear, Base, and Bull Cases: 6.5x, 8.5x, 10.5x
To provide a more nuanced valuation analysis, we've developed bear, base, and bull case scenarios using multiples of 6.5x, 8.5x, and 10.5x respectively. These scenarios reflect different market conditions and growth trajectories for ManoMano, considering both industry-specific challenges and opportunities in the European DIY e-commerce space.
| Scenario | 2026 Growth Rate (%) | Multiple |
|---|---|---|
| Bear 🐻 | 20% | 6.5 |
| Base 📈 | 35% | 8.5 |
| Bull 🚀 | 50% | 10.5 |
Looking at the scenarios, even the conservative bear case assumes continued strong growth at 20% with a 6.5x multiple, while the bull case envisions aggressive 50% growth and a 10.5x multiple. The base case of 35% growth and 8.5x multiple represents a balanced view between these extremes.
| Bear 🐻 | 2021 | 2022 | 2023 | 2024 | 2025 | 2026 |
|---|---|---|---|---|---|---|
| Revenue | $1.9B | $2.6B | $3.4B | $4.4B | $5.4B | $6.4B |
| Growth | 44.43% | 37.86% | 32.21% | 26.57% | 22.91% | 20% |
| Base 📈 | 2021 | 2022 | 2023 | 2024 | 2025 | 2026 |
|---|---|---|---|---|---|---|
| Revenue | $1.9B | $2.7B | $3.7B | $5.2B | $7B | $9.5B |
| Growth | 44.43% | 41.89% | 39.71% | 37.53% | 36.12% | 35% |
| Bull 🚀 | 2021 | 2022 | 2023 | 2024 | 2025 | 2026 |
|---|---|---|---|---|---|---|
| Revenue | $1.9B | $2.8B | $4.1B | $6B | $9B | $13.5B |
| Growth | 44.43% | 45.92% | 47.21% | 48.50% | 49.34% | 50% |
Our bear, base, and bull cases for ManoMano reflect varying scenarios of market competition, growth sustainability, and business model evolution through 2026
- In the bear case, ManoMano's growth decelerates to 20% by 2026, reaching a valuation of $41.8B with $6.4B in revenue at a 6.5x multiple
- In the base case, the company maintains 35% growth while successfully balancing B2C and B2B operations, achieving an $80.5B valuation with $9.5B in revenue at an 8.5x multiple
- In the bull case, ManoMano achieves 50% growth through European market dominance and platform expansion, resulting in a $141.7B valuation with $13.5B in revenue at a 10.5x multiple.
| Scenario | 1. Bear 🐻 | 2. Base 📈 | 3. Bull 🚀 |
|---|---|---|---|
| 2021 Revenue | $1.9B | $1.9B | $1.9B |
| 2021 Growth Rate (%) | 44% | 44% | 44% |
| 2021 Multiple | 6.5 | 8.5 | 10.5 |
| 2021 Valuation | $12.3B | $16.1B | $19.8B |
| 2026 Revenue | $6.4B | $9.5B | $13.5B |
| 2026 Growth Rate (%) | 20% | 35% | 50% |
| Multiple | 6.5 | 8.5 | 10.5 |
| 2026 Valuation | $41.8B | $80.5B | $141.7B |
The uncertainty around these three cases depends primarily on how ManoMano navigates competition from traditional retailers' online expansion, maintains its growth trajectory amid market pressures, and successfully develops new revenue streams through its B2B marketplace, fulfillment services, and advertising platform.
- In the Bear case: Increased competition from incumbent DIY retailers' growing online presence, combined with inflationary pressures and post-COVID market cooling, leads ManoMano to struggle maintaining growth rates and market share, particularly as traditional retailers leverage their physical stores for faster delivery.
- In the Base case: ManoMano successfully balances its B2C and B2B (ManoMano Pro) marketplaces while expanding its fulfillment services across Europe, maintaining healthy growth through its differentiated expert advice model and broad product selection, though facing some headwinds from traditional retailers' digital transformation.
- In the Bull case: ManoMano achieves dramatic growth by dominating cross-border European DIY commerce, successfully scaling its advertising business, and transforming ManoMano Pro into a full-service platform for professionals that includes payment processing, job matching, and vertical SaaS solutions.
These final valuations present a wide range of potential outcomes for ManoMano. Even the bear case projects a substantial valuation of $41.8B in 2026, while the bull case at $141.7B would position ManoMano as a major player in the European DIY ecommerce market.
DISCLAIMERS
This report is for information purposes only and is not to be used or considered as an offer or the solicitation of an offer to sell or to buy or subscribe for securities or other financial instruments. Nothing in this report constitutes investment, legal, accounting or tax advice or a representation that any investment or strategy is suitable or appropriate to your individual circumstances or otherwise constitutes a personal trade recommendation to you.
This research report has been prepared solely by Sacra and should not be considered a product of any person or entity that makes such report available, if any.
Information and opinions presented in the sections of the report were obtained or derived from sources Sacra believes are reliable, but Sacra makes no representation as to their accuracy or completeness. Past performance should not be taken as an indication or guarantee of future performance, and no representation or warranty, express or implied, is made regarding future performance. Information, opinions and estimates contained in this report reflect a determination at its original date of publication by Sacra and are subject to change without notice.
Sacra accepts no liability for loss arising from the use of the material presented in this report, except that this exclusion of liability does not apply to the extent that liability arises under specific statutes or regulations applicable to Sacra. Sacra may have issued, and may in the future issue, other reports that are inconsistent with, and reach different conclusions from, the information presented in this report. Those reports reflect different assumptions, views and analytical methods of the analysts who prepared them and Sacra is under no obligation to ensure that such other reports are brought to the attention of any recipient of this report.
All rights reserved. All material presented in this report, unless specifically indicated otherwise is under copyright to Sacra. Sacra reserves any and all intellectual property rights in the report. All trademarks, service marks and logos used in this report are trademarks or service marks or registered trademarks or service marks of Sacra. Any modification, copying, displaying, distributing, transmitting, publishing, licensing, creating derivative works from, or selling any report is strictly prohibited. None of the material, nor its content, nor any copy of it, may be altered in any way, transmitted to, copied or distributed to any other party, without the prior express written permission of Sacra. Any unauthorized duplication, redistribution or disclosure of this report will result in prosecution.