We're launching Sacra Signals, a new cited revenue intelligence layer that extracts, labels, and validates revenue datapoints from public sources across the web so revenue figures on Sacra trace back to a sources you can verify.
Sacra Signals is live now for 30 pre-IPO companies with 426 metric observations backed by almost 2,000 citations, available on the web, via API, via Sacra MCP for Claude and ChatGPT, and in Google Sheets.
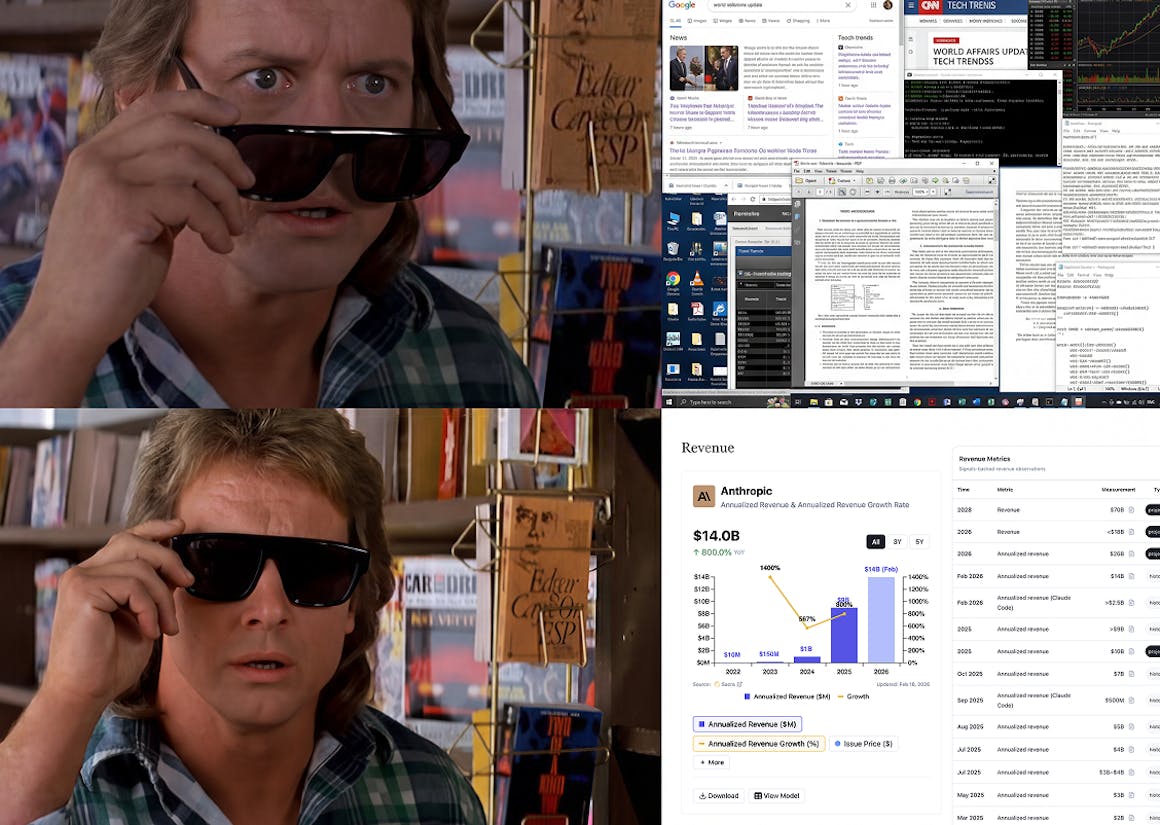
View Sacra Signals for Anthropic, OpenAI and Databricks today.
Why we built it
Private market revenue data is hard to trust. Numbers float around the internet in press releases, LinkedIn posts, podcast transcripts, and news articles, but they're scattered across sources, inconsistently labeled, and rarely cited. Is that "$100M" figure ARR or annualized run rate? Is it as of January or July? Is it trailing or forward?
This ambiguity compounds. One source says "revenue," another says "ARR," and a third says "run rate", and they might all be describing different numbers for the same company at different points in time. Aggregators and AI models that scrape this data without careful labeling end up mixing apples and oranges, producing estimates that look precise but aren't.

We've been doing this work by hand at Sacra for years to build our revenue models and research reports. Sacra Signals automates that process, creating a structured, cited data layer underneath our models that both we and our customers can build on.
How it works
Sacra Signals runs an AI-automated pipeline across three stages:
1. Extraction. Agents crawl public sources like news articles, press releases, earnings coverage, LinkedIn posts, and podcast transcripts, and pull out raw datapoints that reference revenue figures, growth rates, and related metrics.
2. Labeling. A second layer of agents labels each datapoint with structured metadata: the company, the metric type (recurring revenue, trailing revenue, or run rate), whether it's a historical actual or a projection, the as-of date or date range, the currency and amount, and growth rate.
This is where the hard disambiguation happens: distinguishing ARR from annualized run rate, resolving fiscal year conventions, handling vague time references like "over the last 10 months," and filtering out figures that look like revenue but are actually amounts raised or valuations.

3. Validation & QA. A third layer cross-checks extracted signals against each other and against existing data, flagging duplicates, contradictions, and low-confidence labels for review. Signals that pass QA are promoted into metric observations that feed our models and are exposed to users.
Every signal traces back through the chain: from the labeled metric observation, to the quoted datapoint and its surrounding context, to the original source article or post. You can verify any number by clicking through to the citation.
What's covered
We're starting with revenue, the single most important and most contested metric in private markets, across three metric types:
- Recurring revenue (ARR/MRR)
- Trailing revenue (TTM/annual)
- Run rate revenue (annualized)
Each metric type supports both historical actuals and forward projections, in both absolute value and growth rate views.
Sacra Signals is live for 30 pre-IPO companies: Anduril, Anthropic, ByteDance, Canva, Cerebras, Crusoe, Cursor, Databricks, Deel, Discord, Fanatics, Glean, Harvey, Kalshi, Kraken, Mercor, Neuralink, Notion, OpenAI, Oura, Perplexity, Polymarket, Ramp, Revolut, Rippling, Scale AI, Shield AI, SpaceX, Stripe, and xAI.
We're expanding company coverage continuously—and extending to new metric types including GMV, GTV, take rate, gross margin, customer count, user count, and DAU/WAU/MAU.
Where to access it
The same Signals data is available everywhere you use Sacra:
- Sacra Web — cited revenue data in the Revenue section of each company profile
- API — via the /api/v1/metrics endpoint (API docs)
- MCP — pull cited revenue data into Claude or ChatGPT or your own server-side agent
- Google Sheets — model directly in a spreadsheet with live Signals data in the appendix
What's next
Revenue is the starting point. The same extraction, labeling, and validation pipeline generalizes to any quantitative metric that surfaces in public sources, which means we can expand to GMV, gross margin, customer counts, engagement metrics, and more using the same architecture.
We also intend to use Signals as the data layer that feeds our revenue models and research programmatically, so that as new datapoints are extracted and validated, models update and reports reflect the latest available evidence automatically.
If you have questions, requests for specific companies or metrics, or issues with any datapoints, email us at founders@sacra.com.


