We're thrilled to launch Sacra Charts, an incredibly easy way to create custom revenue visualizations out of Sacra data on startups, growth and pre-IPO companies.
Add any Sacra revenue or growth rate dataset to the chart. Customize colors, lines and bars and labels. Then download your charts as an image to include in your memos, presentations, decks, blog posts and more.
Sacra Charts is available now for Sacra members.
To get started, sign up to become a Sacra member and start charting!
Sacra Charts in the wild
Our ambition at Sacra is to bring a higher standard to private company revenue data. Until now, most publicly available revenue data on growth and pre-IPO companies has been based off of crude proxies like headcount and valuation.
At Sacra, we take the opposite approach—we build bottom-up models on the companies that we work on. Instead of automating model generation, we use AI to speed up the collection of the underlying data points, which our analysts use to build their models faster.
We believe that our approach is paying off. You may have seen Sacra revenue data and charts on your favorite podcast and not even have realized it.
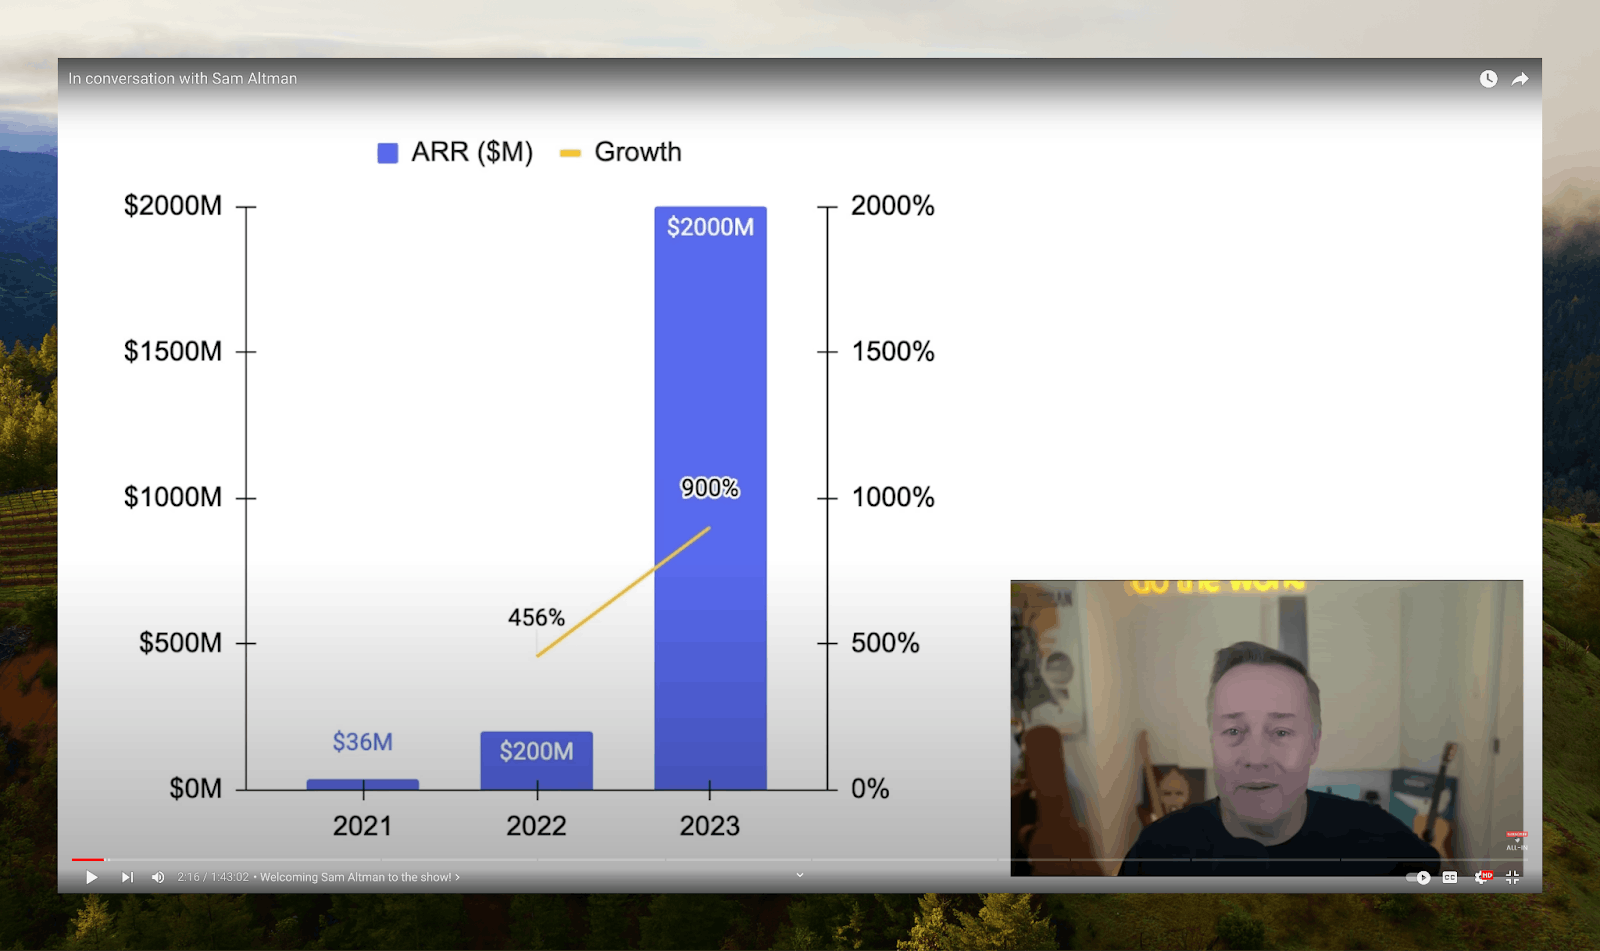
Sacra charts on the All-in-Podcast
With Sacra Charts, we're making it very simple to produce useful revenue visualizations on private companies, adding multiple datasets to comp companies and their growth rates.
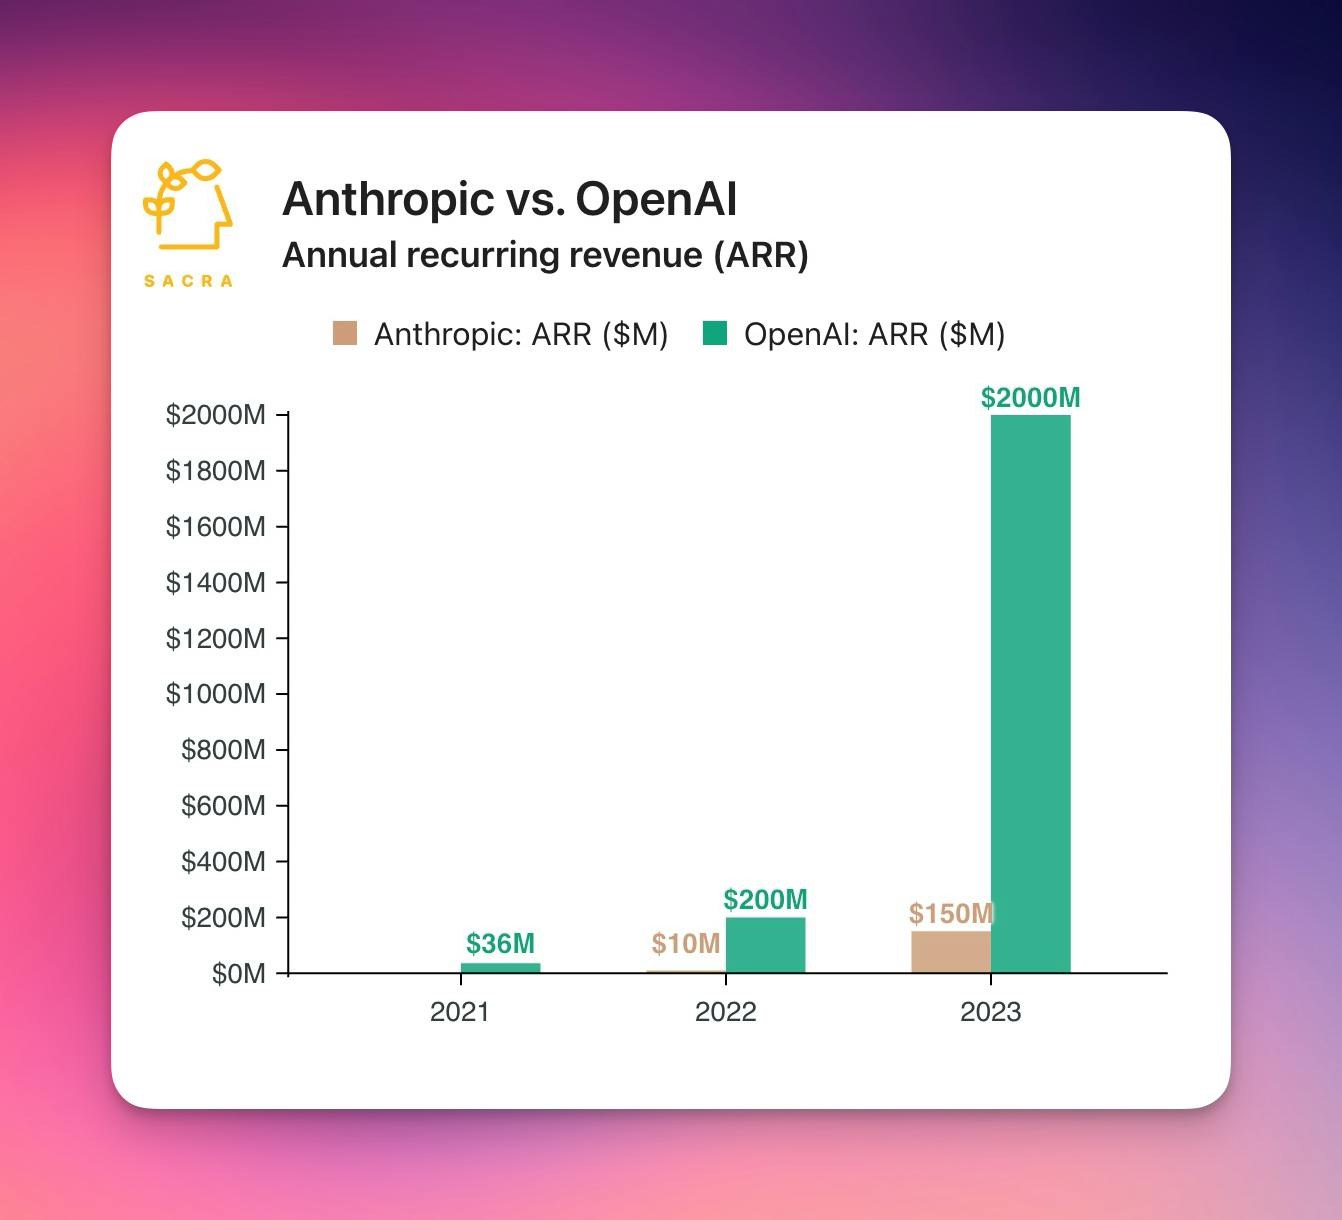
Comping Anthropic vs OpenAI on revenue, made in 1 minute using Sacra Charts
Now everyone has the power to create custom charts of startup revenue data
Powered by the Sacra API
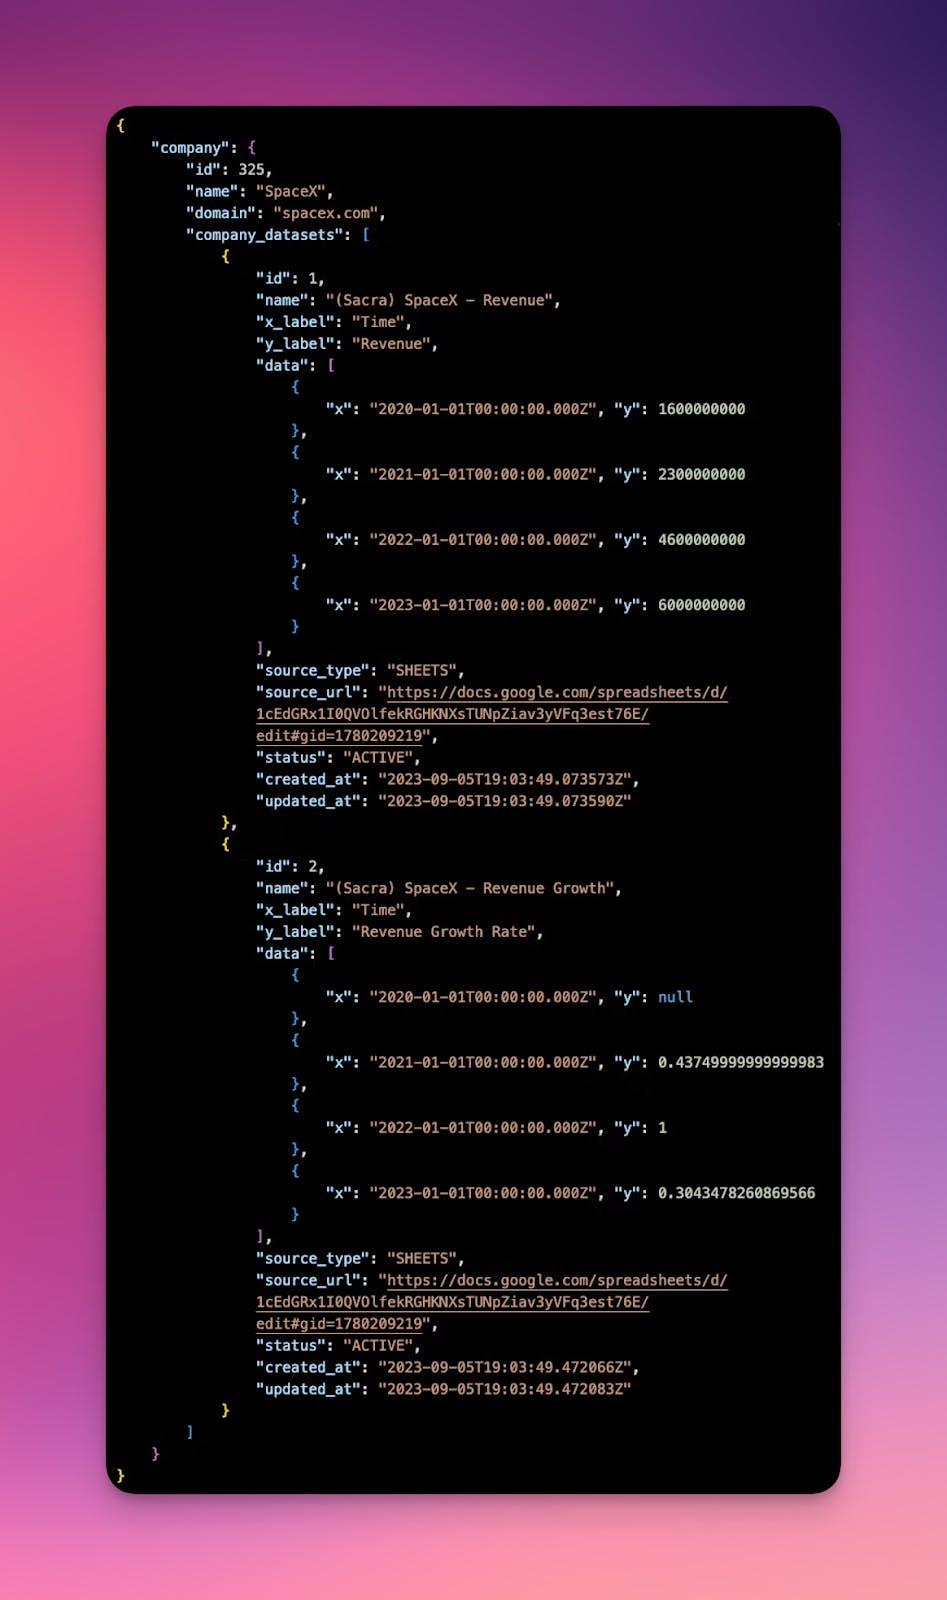
In fall of last year, we launched revenue data into our Company API.
Pass our API a company domain, and we will return time series revenue data on that company.
Our partners Caplight and Augment—two marketplaces for pre-IPO stock—are just two startups that have integrated our research and revenue data into their own app experiences.
Sacra Charts builds on top of our own APIs for company revenue data. To start with, we're making it easy for members to build graphs and then export them as images. Upcoming, we're building more ways to embed charts into your own app and website.
Start Charting
Sacra Charts is currently only available to Sacra members.
To become a member, sign up here. Then, just click on "Charts" in the left hand toolbar and start charting!


