Revenue
$40.00M
2023
Funding
$200.00M
2021
Product

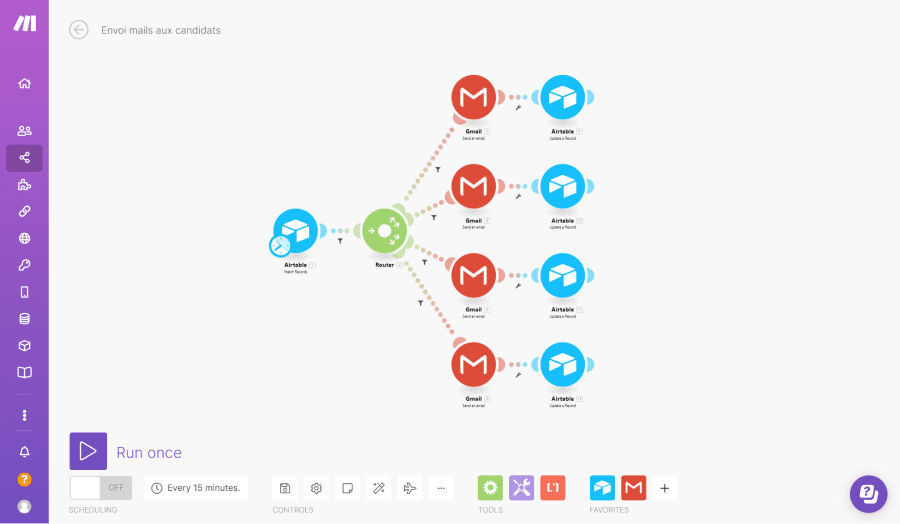
Make was formerly known as Integromat—built by the Czech systems integrator Integrators.cz as part of their work doing integration consulting work for large Czech companies like banks. After Zapier was founded in 2011 and started to grow quickly, the team at Make realized there was a market for a end-user focused "API of APIs" and they started to pivot around this idea of no-code app automation.
The product launched in 2016, competing directly with products like Zapier and Tray.io, but aiming to position itself as a more work-focused alternative. One of the key lynchpins in that strategy is Make's wider endpoint availability—where Zapier is often limited to a few select endpoints from an app, and has indexed on quantity of integrations, Make has aimed to capture a more business-focused user base by covering a wider range of endpoints, allowing their users to build more sophisticated integrations with them.
This strategy comes with an added operational cost for Make. One of the keys to Zapier's highly capital efficient growth over the last decade has been the fact that they rarely end up building integrations themselves—they mostly rely on their 3rd-party partners to build those integrations for them. Make has a team of people adding new integrations based on user requests, which increases their costs.
Competition

Make's main competitor is fellow no-code automation and integration tool Zapier. Both companies are focused on helping "business consumers" or non-technical end users inside corporations build relatively simple automations between tools like Google Sheets, Outlook, Airtable, and so on.
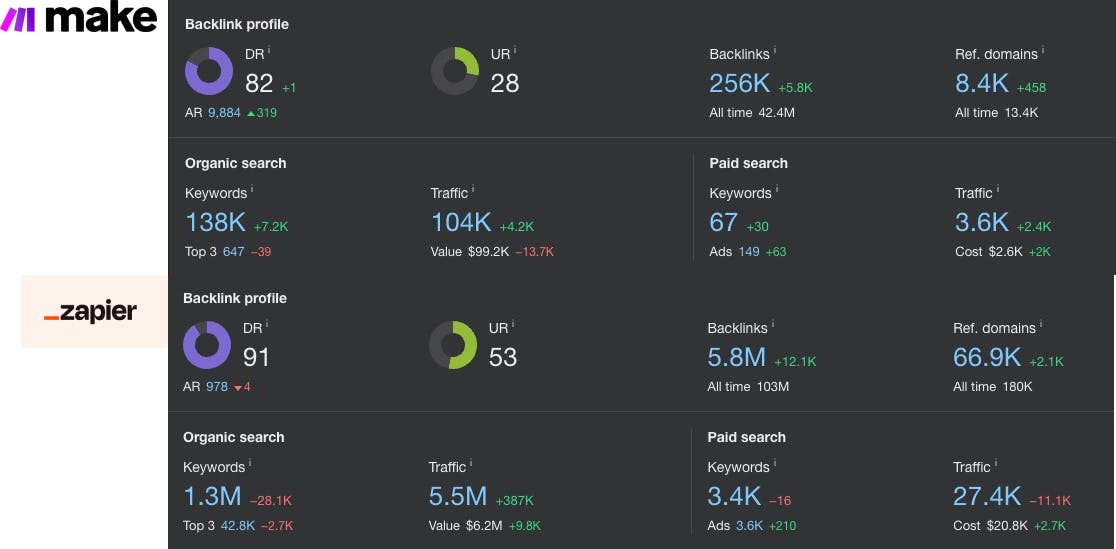
Today, Zapier has a significant scale advantage on Make by way of their decade-long programmatic SEO strategy: Zapier has 5.8M backlinks to Make's 256K and approximately 5.5M monthly visits vs. Make's 104K.
For several years, Make differentiated from Zapier on the basis of being lower-cost, having a visual automation builder (as opposed to Zapier's more linear, table-based builder), and having 2x more API endpoints per app (though fewer apps overall, with Make boasting 1,600 app integrations to Zapier's 5,000+).
In August 2023, Zapier released a visual builder to go along with their more linear builder experience, but the pricing is still a point of differentiation—the core paid plan on Make is $9/month with an allowance for 10,0000 tasks per month, while on Zapier the equivalent plan costs $19/month and only allows for 750 tasks per month.
At the same time, both Zapier and Make risk being disintermediated with the rise of native integration APIs like Tray.io and Paragon, verticalized automation solutions like Alloy Automation and Parabola, and productivity platforms like Airtable and Notion building out their own integrations capabilities, all of which aim to offer a better user experience around integrations.
News
DISCLAIMERS
This report is for information purposes only and is not to be used or considered as an offer or the solicitation of an offer to sell or to buy or subscribe for securities or other financial instruments. Nothing in this report constitutes investment, legal, accounting or tax advice or a representation that any investment or strategy is suitable or appropriate to your individual circumstances or otherwise constitutes a personal trade recommendation to you.
This research report has been prepared solely by Sacra and should not be considered a product of any person or entity that makes such report available, if any.
Information and opinions presented in the sections of the report were obtained or derived from sources Sacra believes are reliable, but Sacra makes no representation as to their accuracy or completeness. Past performance should not be taken as an indication or guarantee of future performance, and no representation or warranty, express or implied, is made regarding future performance. Information, opinions and estimates contained in this report reflect a determination at its original date of publication by Sacra and are subject to change without notice.
Sacra accepts no liability for loss arising from the use of the material presented in this report, except that this exclusion of liability does not apply to the extent that liability arises under specific statutes or regulations applicable to Sacra. Sacra may have issued, and may in the future issue, other reports that are inconsistent with, and reach different conclusions from, the information presented in this report. Those reports reflect different assumptions, views and analytical methods of the analysts who prepared them and Sacra is under no obligation to ensure that such other reports are brought to the attention of any recipient of this report.
All rights reserved. All material presented in this report, unless specifically indicated otherwise is under copyright to Sacra. Sacra reserves any and all intellectual property rights in the report. All trademarks, service marks and logos used in this report are trademarks or service marks or registered trademarks or service marks of Sacra. Any modification, copying, displaying, distributing, transmitting, publishing, licensing, creating derivative works from, or selling any report is strictly prohibited. None of the material, nor its content, nor any copy of it, may be altered in any way, transmitted to, copied or distributed to any other party, without the prior express written permission of Sacra. Any unauthorized duplication, redistribution or disclosure of this report will result in prosecution.